Assist Analyzes Your Study Data
Catalyst Assist can now answer questions about the data in your study — counts, averages, distributions, and filtered breakdowns — by querying the dataset directly.
What's included
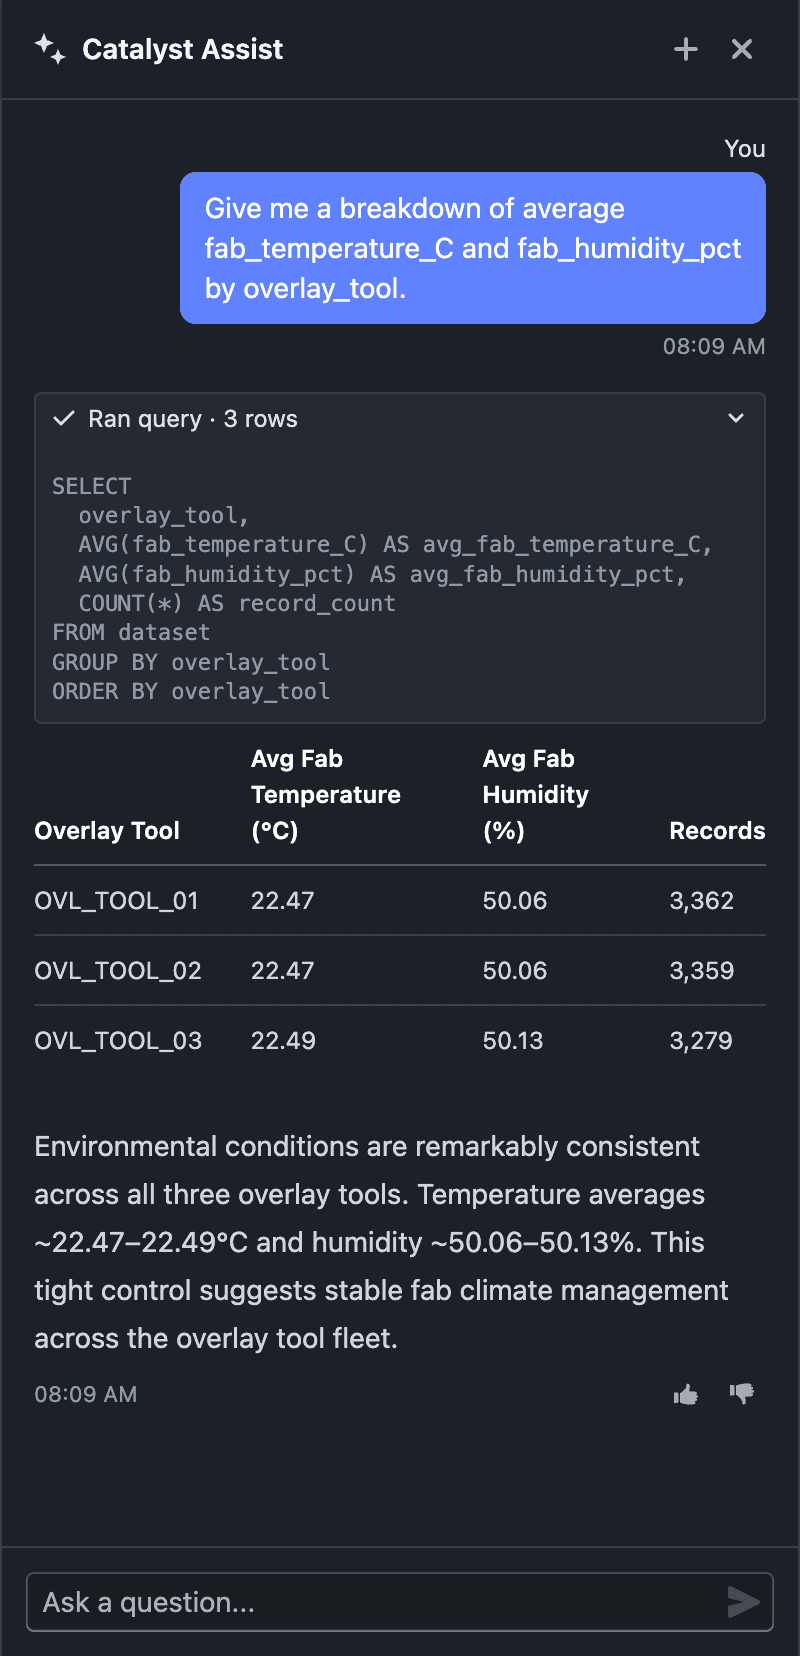
- Ask data questions in natural language — "average overlay error by tool?", "how many wafers failed process control?", "distribution of risk score by lot" — and Assist queries your study dataset to answer
- Answers are computed from your actual data, returned as markdown tables, with a brief takeaway drawn from the results
- Date and duration math is supported — group by year, compare timestamps, measure elapsed time between events
- Platform and feature questions still work exactly as before — Assist picks the right mode for each question
Notes
- Data answers come only from your dataset — Assist never invents, estimates, or extrapolates figures
- Data questions are available when Assist is opened from within a study
- Data queries run on the study's worker, so it must be provisioned and active; otherwise Assist still answers platform and feature questions but can't query the dataset
- AI responses may not always be accurate. If you receive an unexpected result, let us know with the thumbs up/down on the response, or share it via Support → Contact Support
- This is an incremental update during beta