Kaplan-Meier survival analysis
Analyze survival data with Kaplan-Meier curves, supporting event tracking, censored observations, group comparisons, and interactive visualizations.
What's included
Survival curve visualization
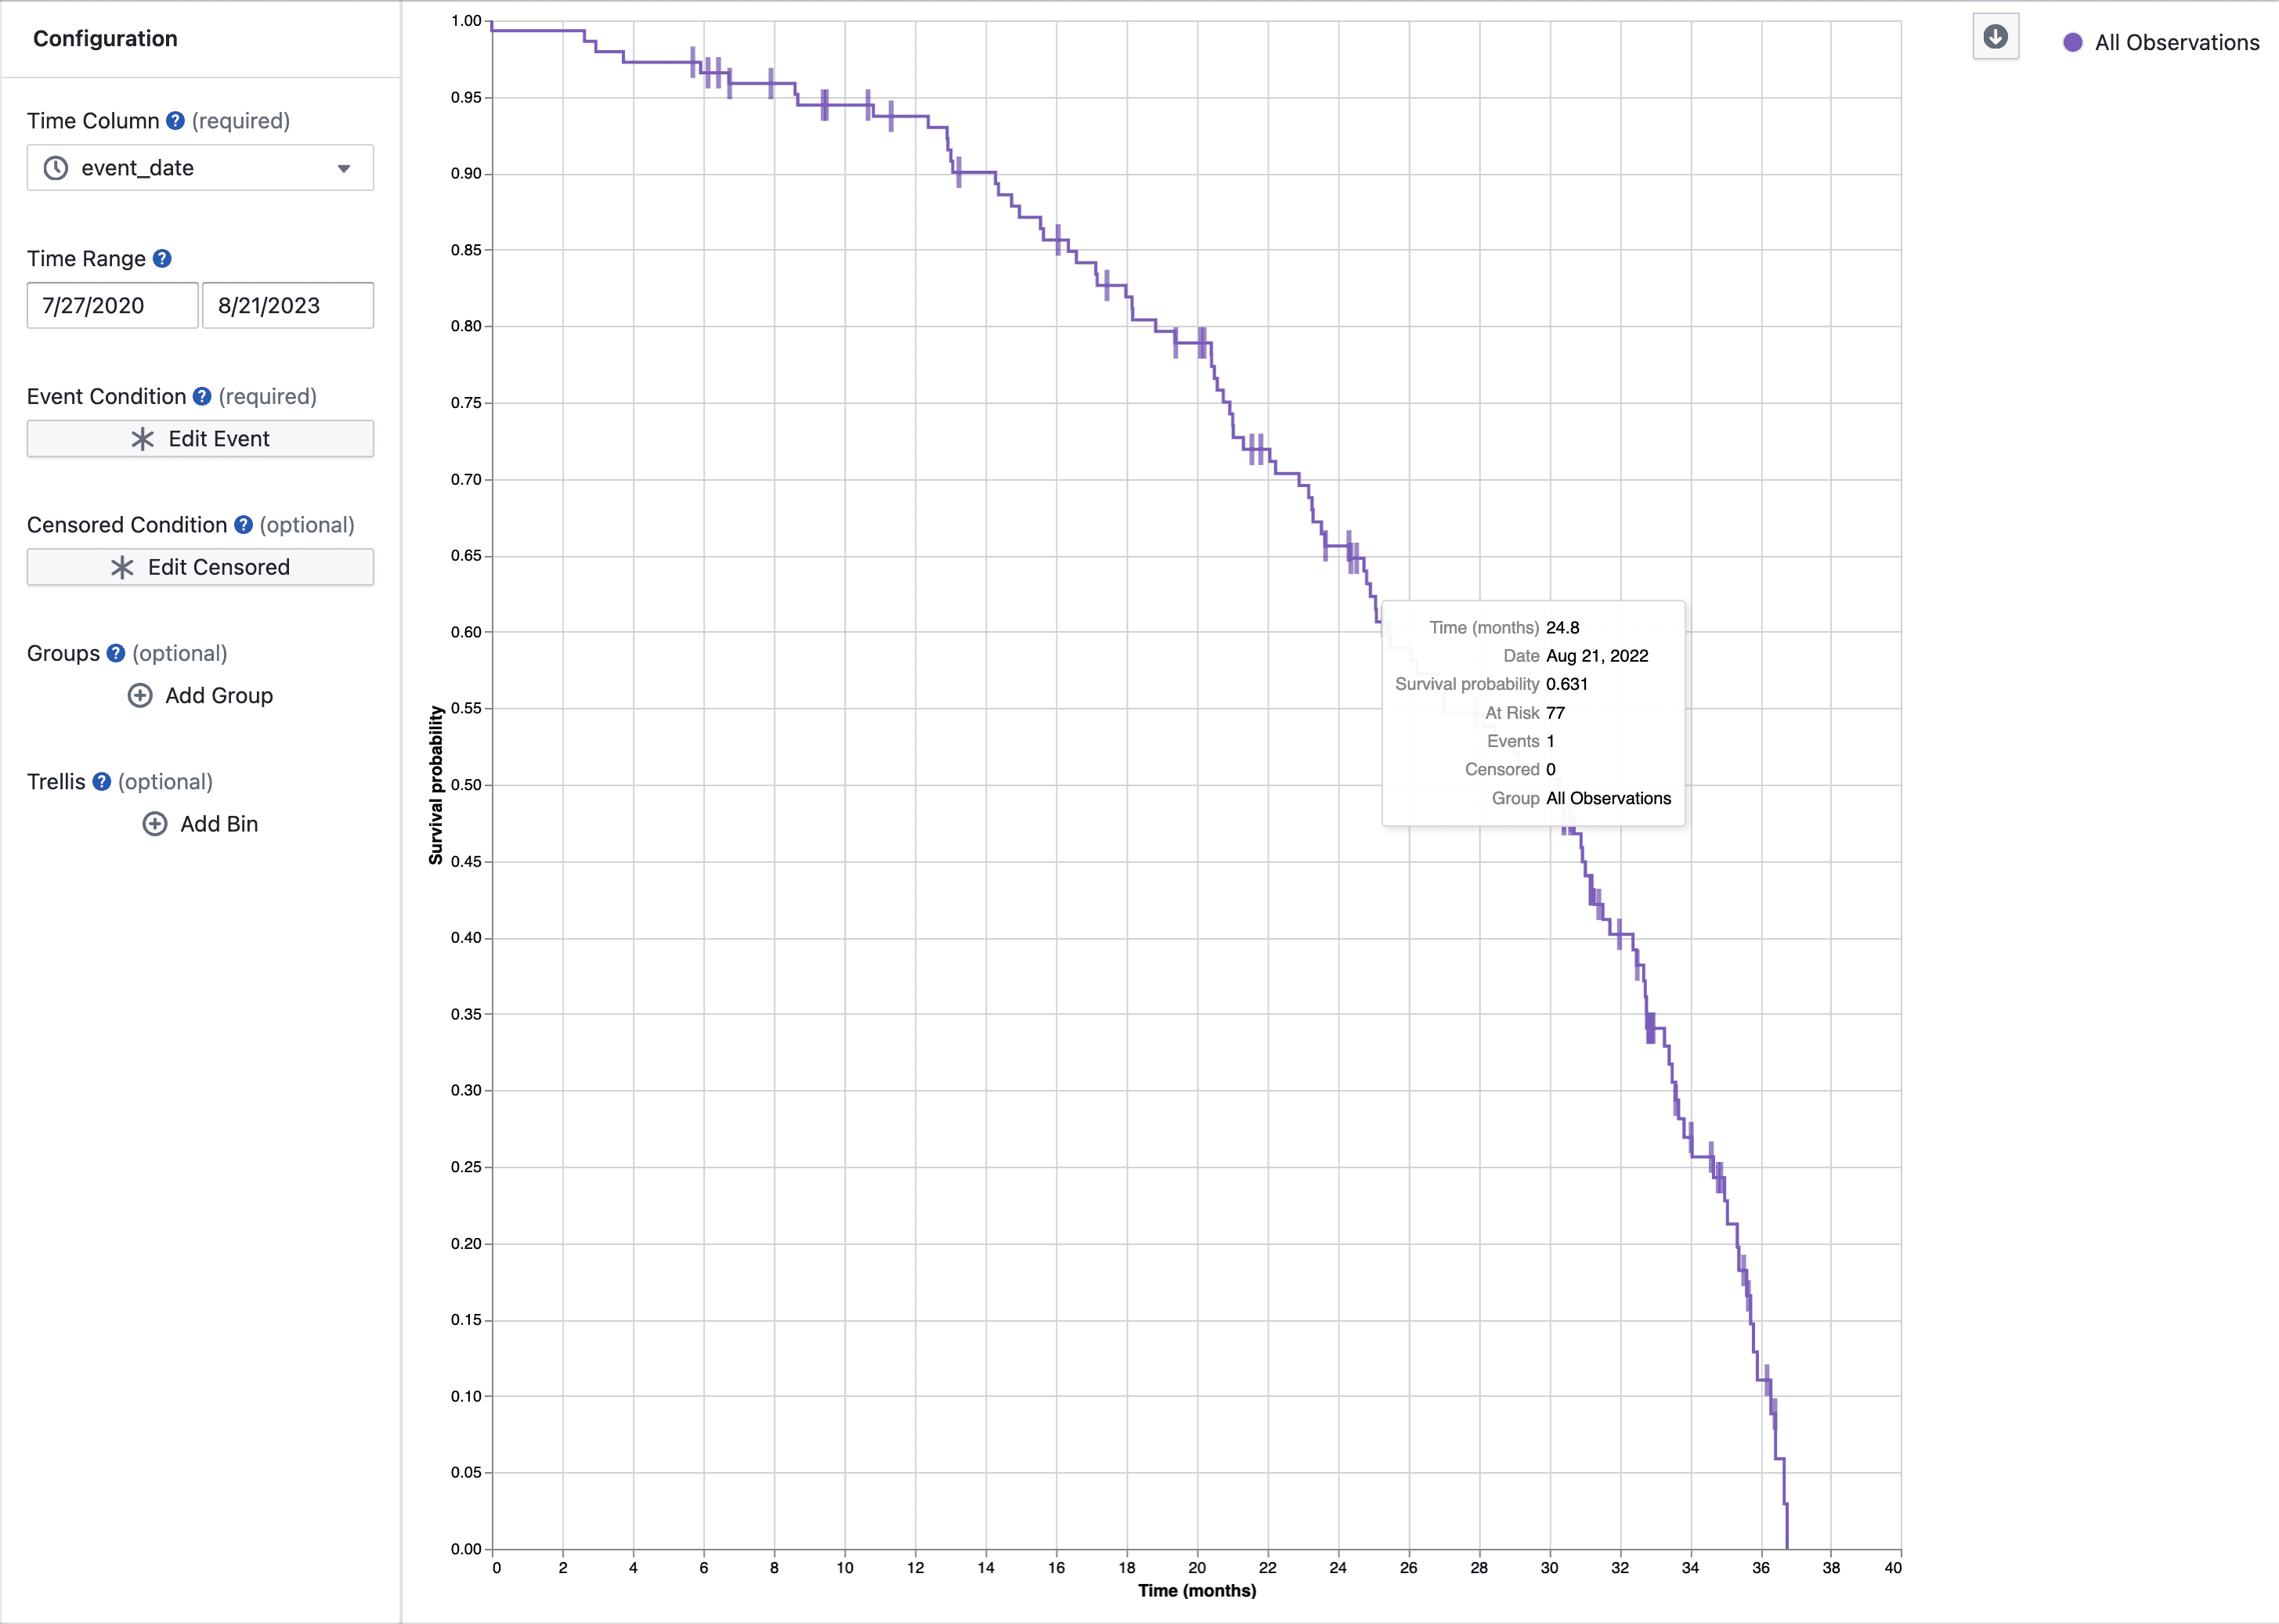
- Step function curves show survival probability over time
- Tick marks indicate subjects who left the study without experiencing the event
- Filter by time period to focus on specific study phases
- Hover over curves to see detailed statistics at each time point
Group comparisons
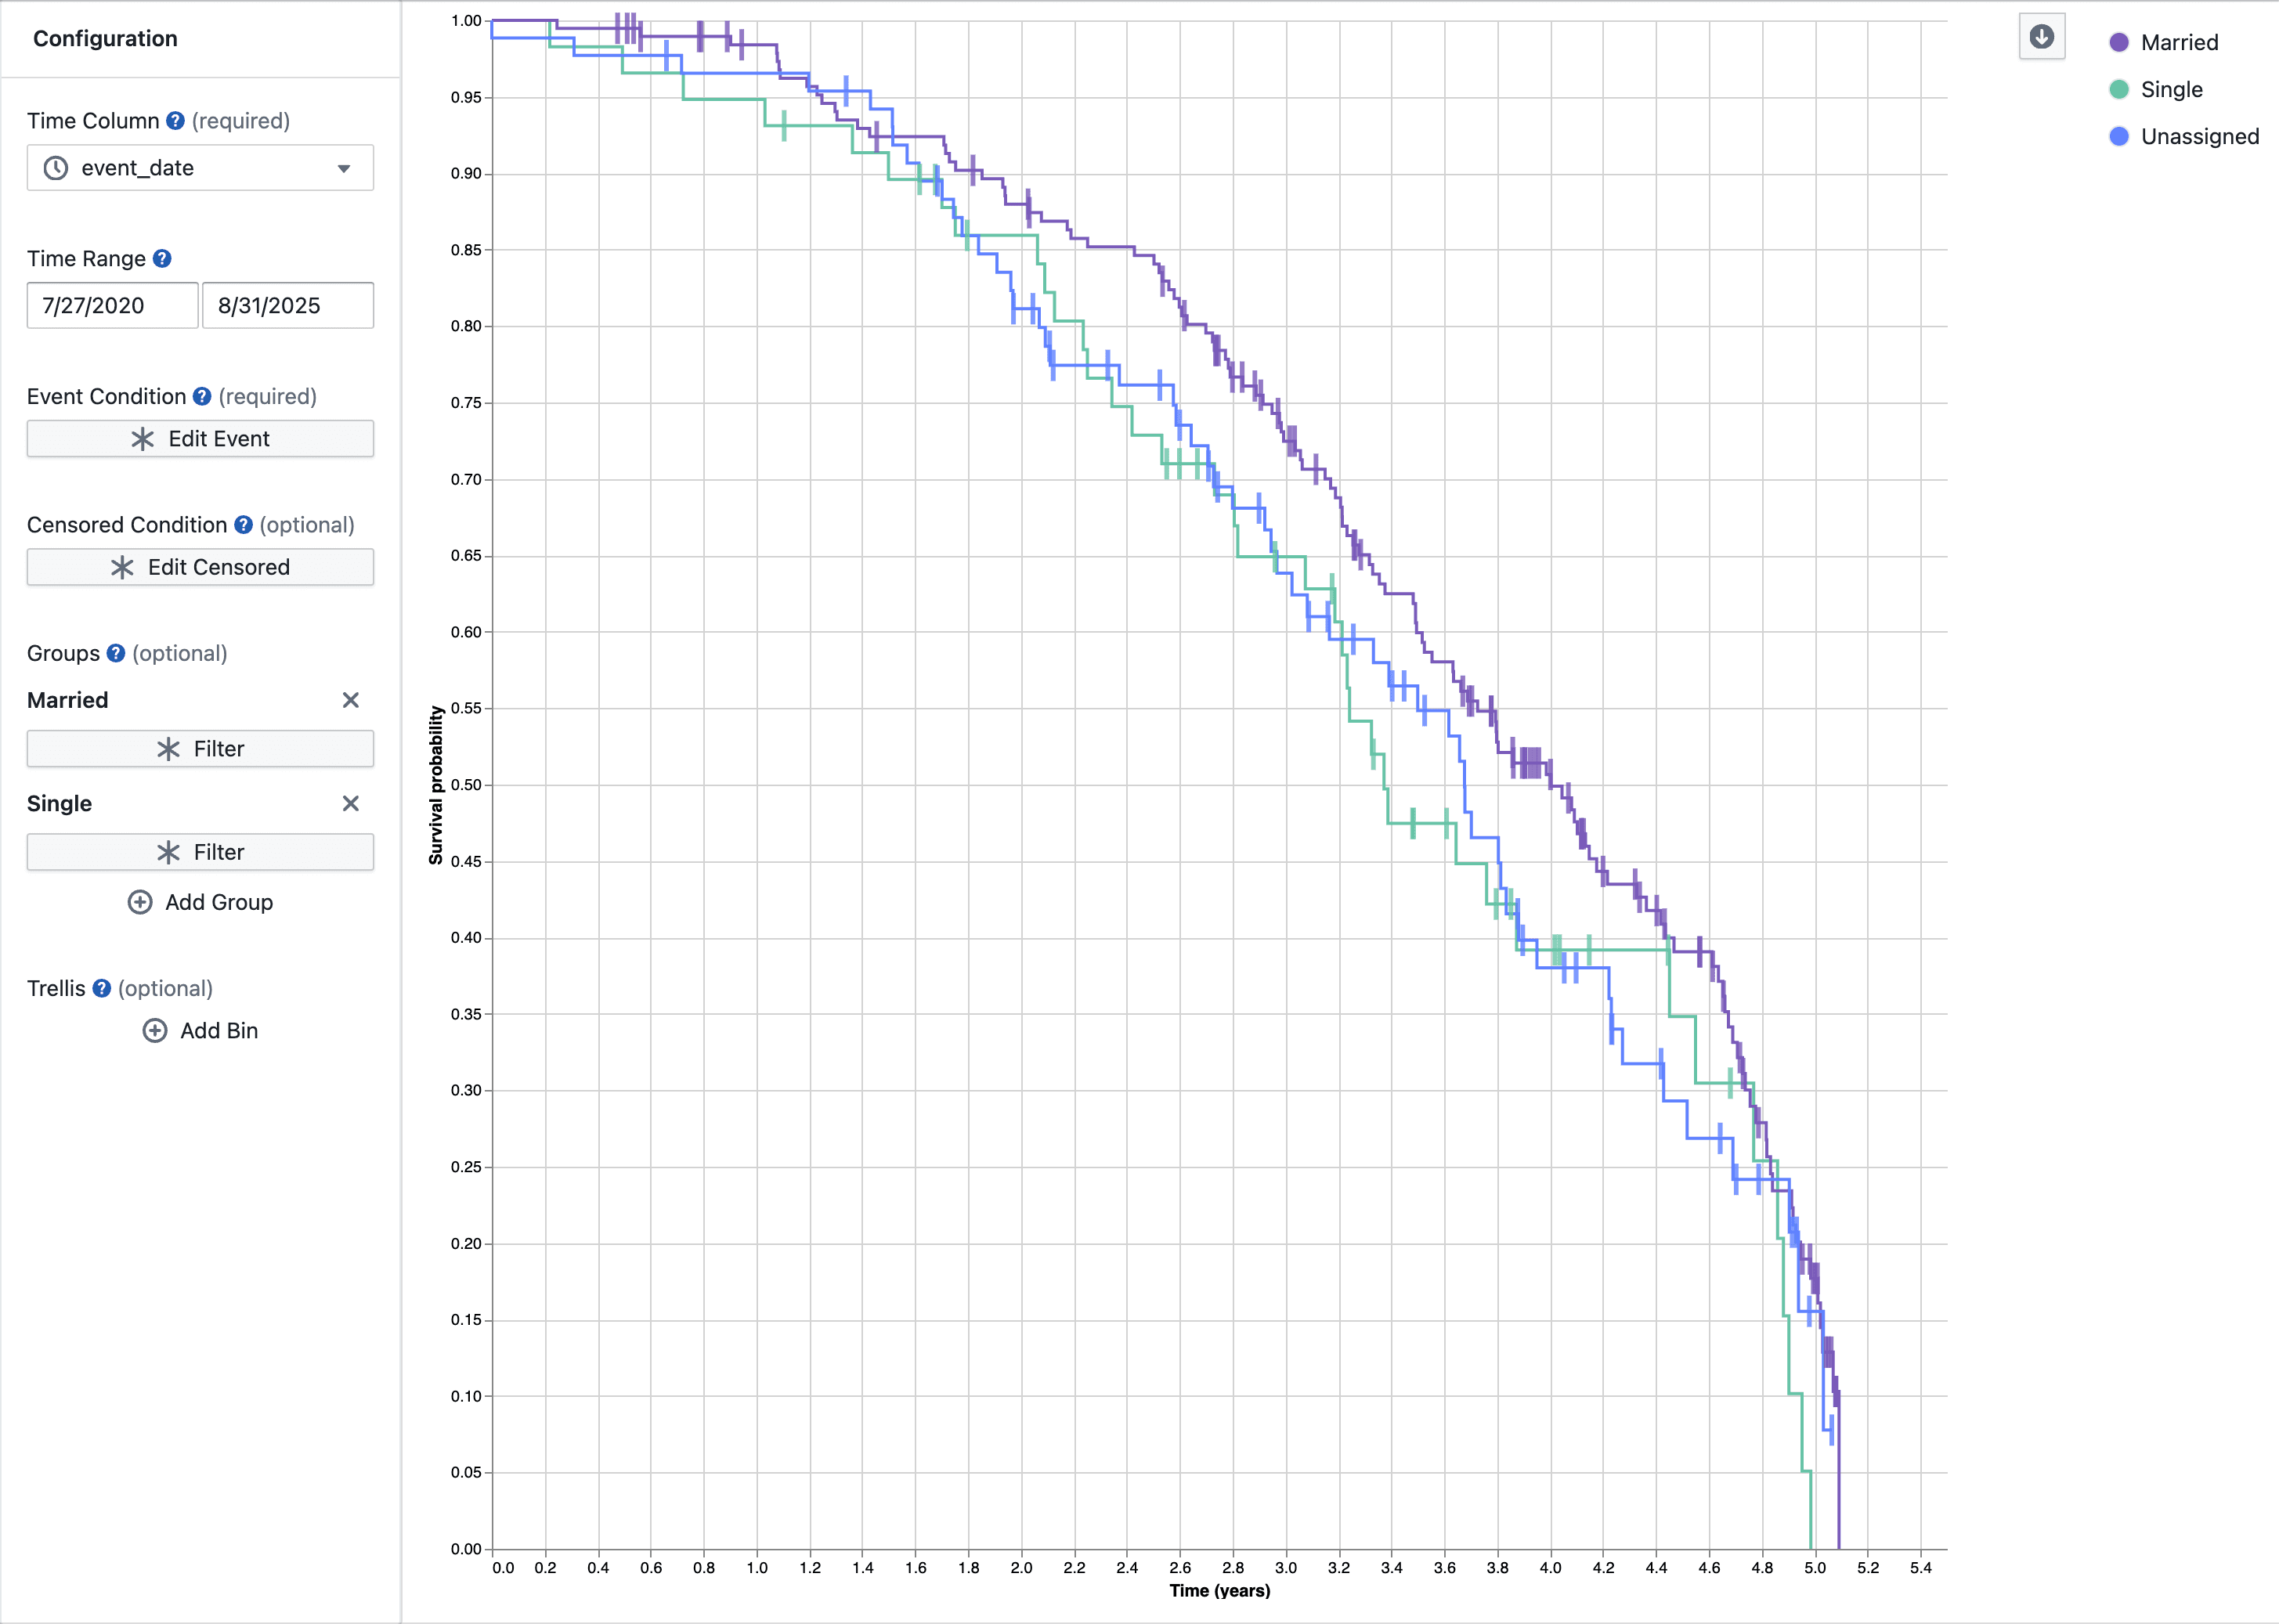
- Compare survival across multiple groups with color-coded curves
- Use filters to define groups
- Legend and tooltips identify each group
Event and censoring logic
- Set event conditions for what you're tracking (e.g., death, disease progression)
- Set censoring conditions for subjects who exit the study early
- Use flexible filters to define complex criteria
- Data not matching either condition is excluded
Multi-panel plots
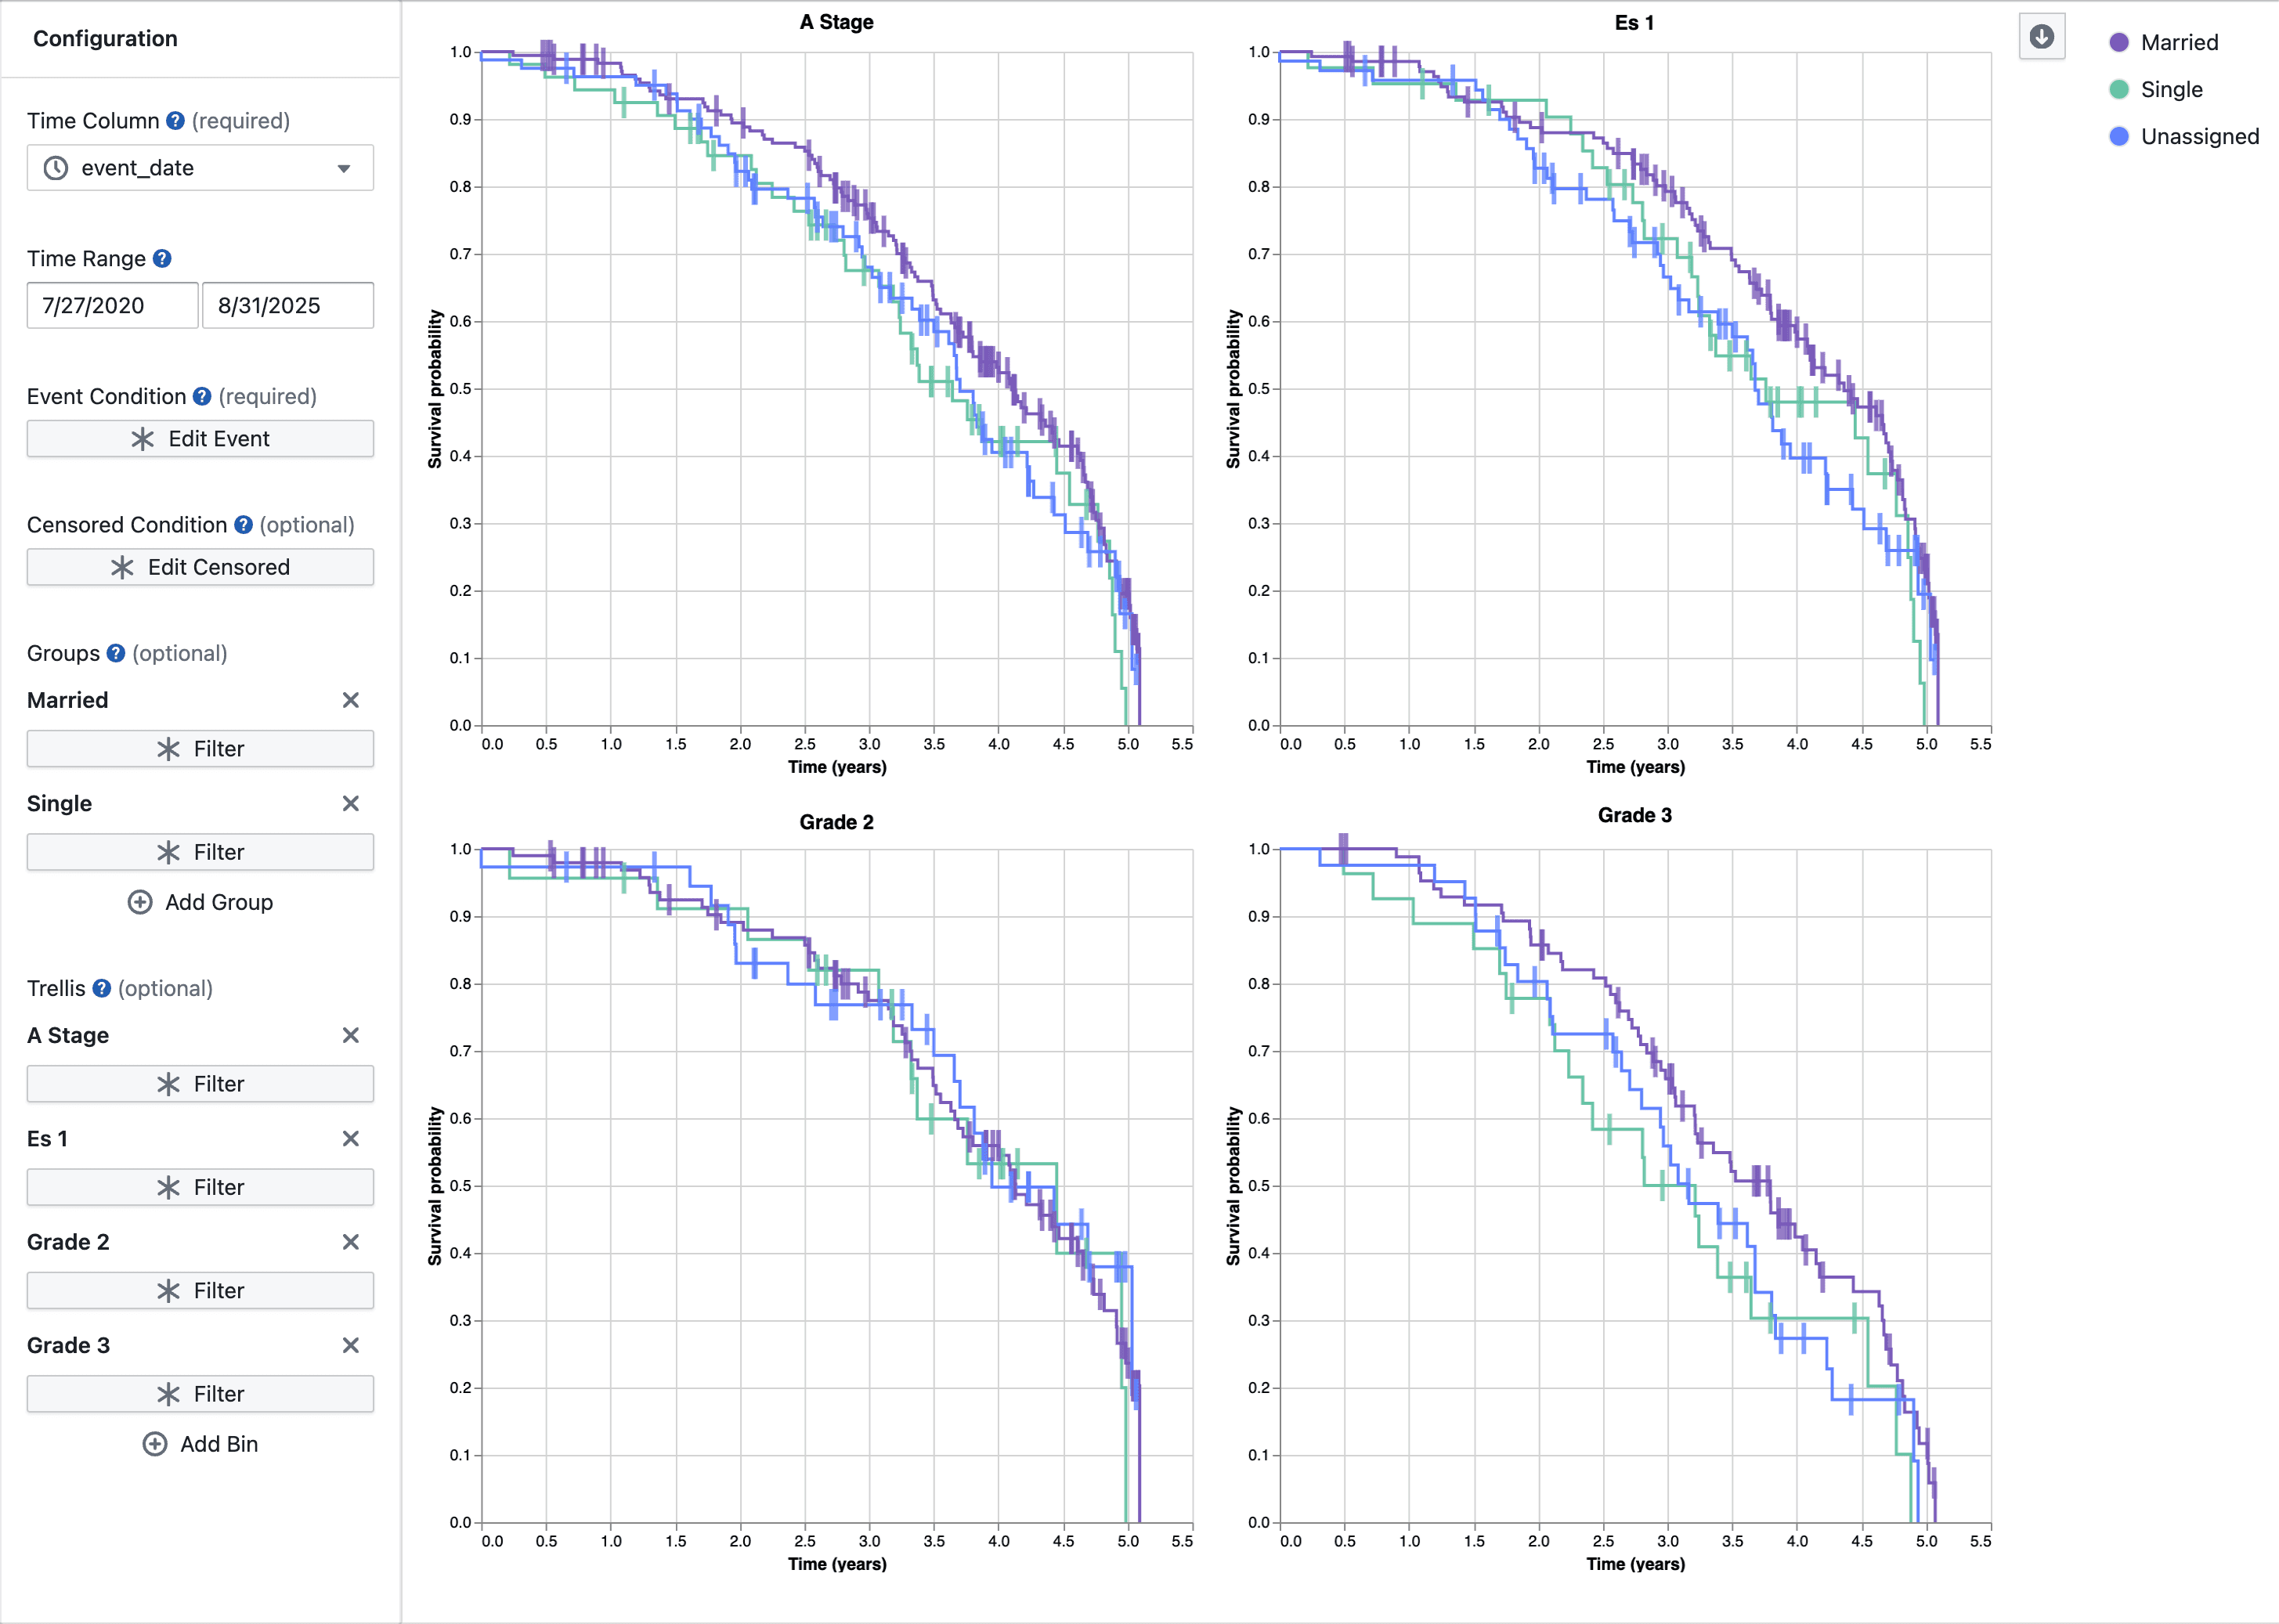
- View multiple survival curves side-by-side in a grid
- Split data by categories for easier comparison
Interactive tooltips
Hover over any point to see:
- Time value and date
- Survival probability
- Subjects at risk
- Events occurred
- Subjects censored
- Group name (when comparing groups)
Notes
- New beta feature - behavior may change based on feedback
- Large datasets are limited to 5000 data points for performance