Trellis plots in Experiment Visualization Convergence
Split convergence plot into a multi-panel grid when multiple targets are selected.
What's included
How it works

- Select multiple targets from the target sidebar
- The convergence plot automatically splits into a grid — one panel per target
- Each panel shares the same x-axis (iteration index) but has an independent y-axis scale
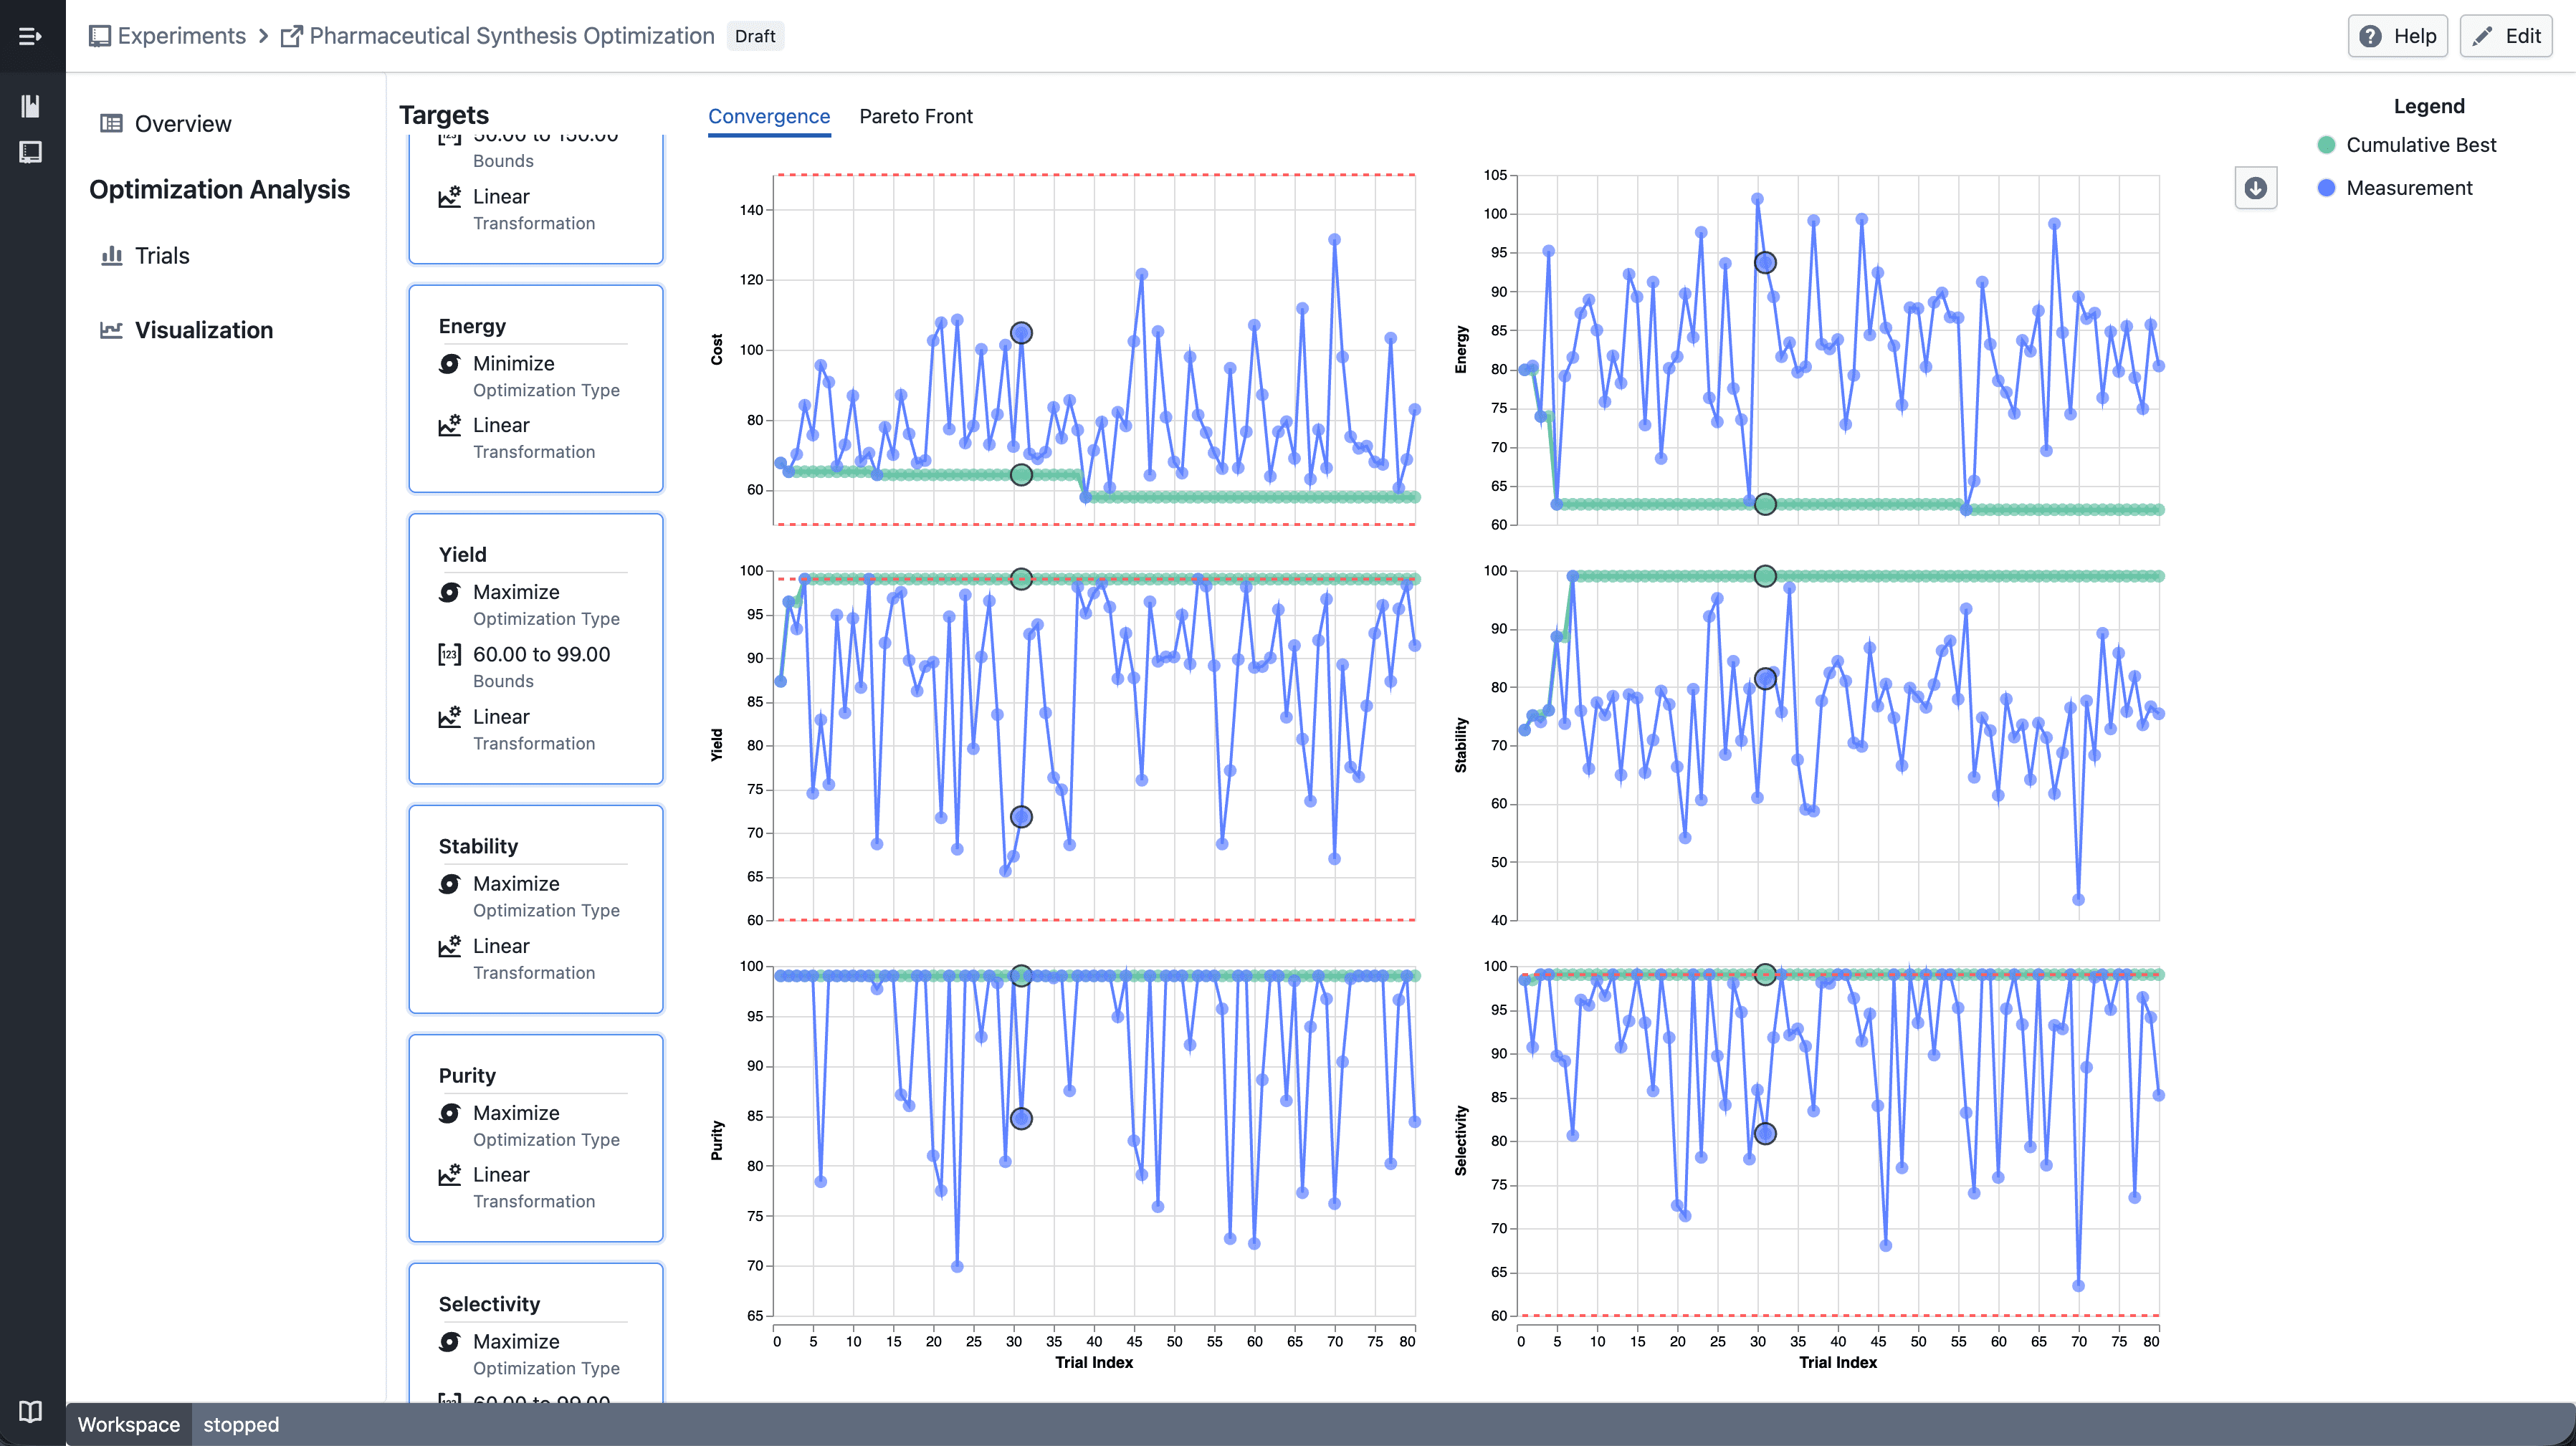
- Click a data point to highlight the corresponding trial across all panels
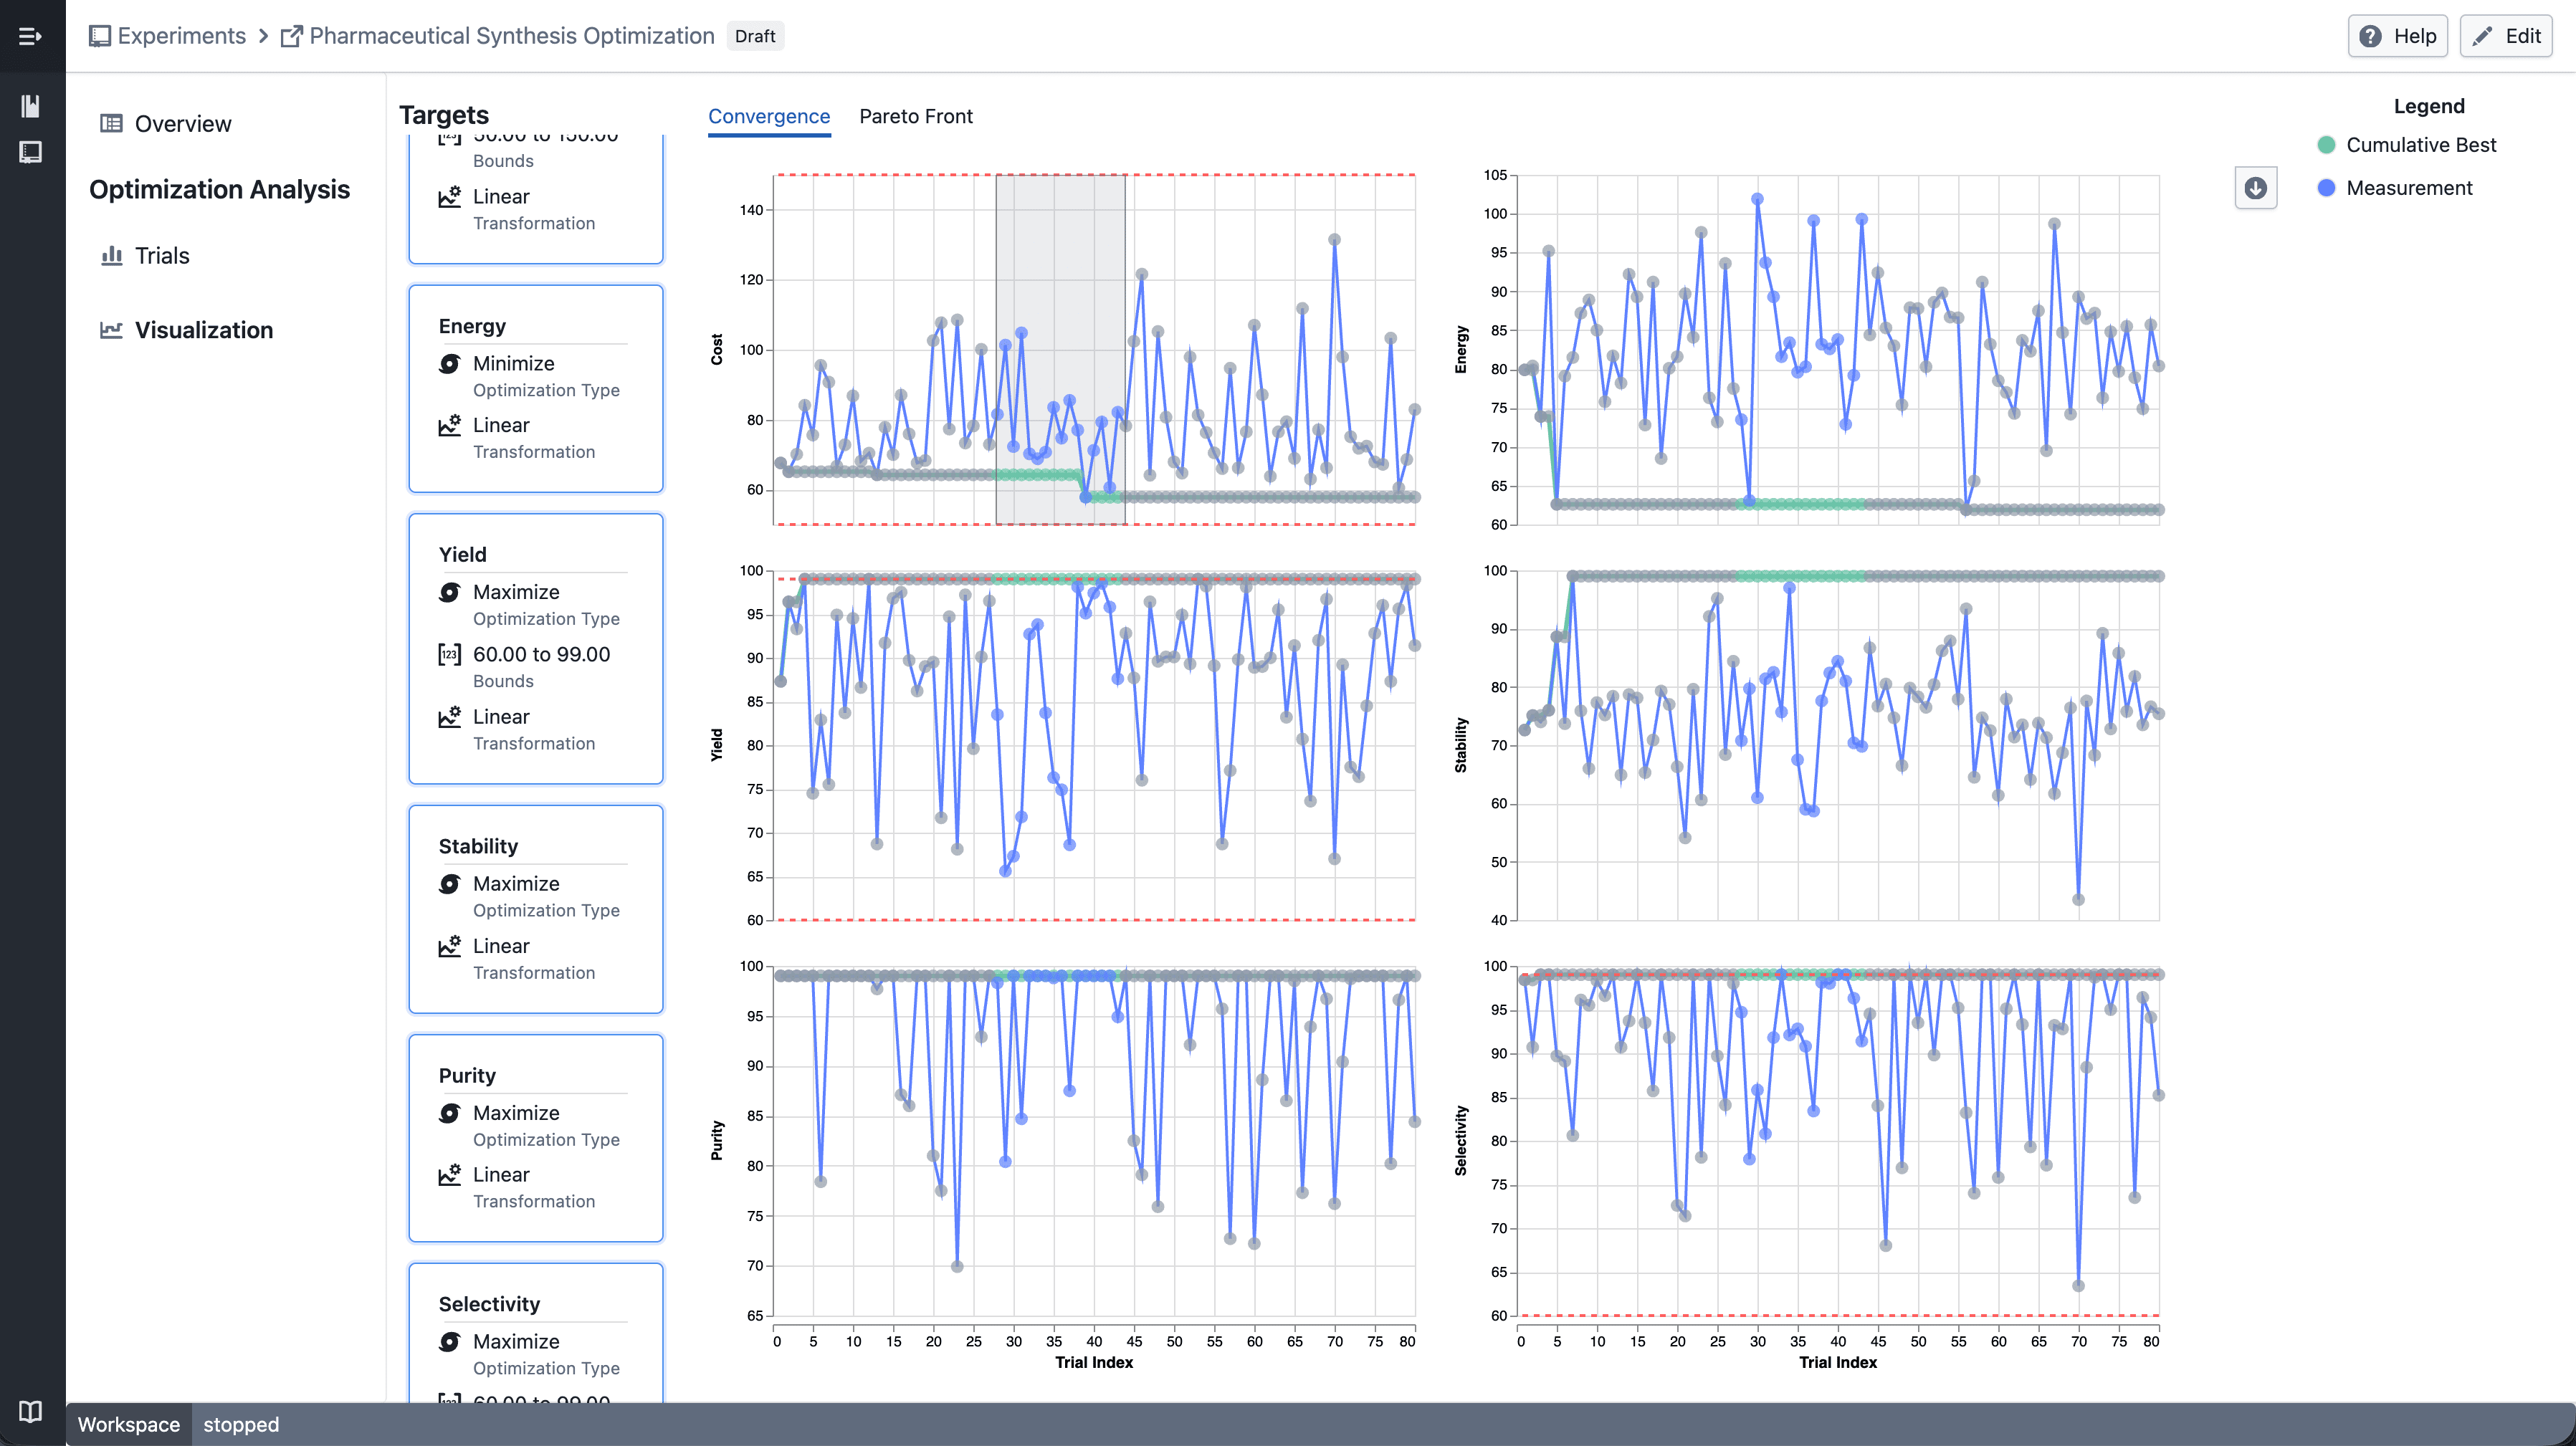
- Shift-drag to draw a brush selection across panels
- Points outside the selection are dimmed
- Up to 6 targets can be displayed at a time
Notes
- Single target selection continues to show the standard convergence plot
- Trellis layout and interactions may continue to evolve during the beta phase
- If you notice any unexpected behavior, please share steps to reproduce