
4 posts tagged with "Visualization"

View All Tags

AI Summary for Plot Builder

Instantly understand any plot with an AI-generated summary — powered by an LLM with vision.

What's included

How it works

AI Summary popover on a scatter plot

  • Click the AI Summary button in the Plot Builder toolbar
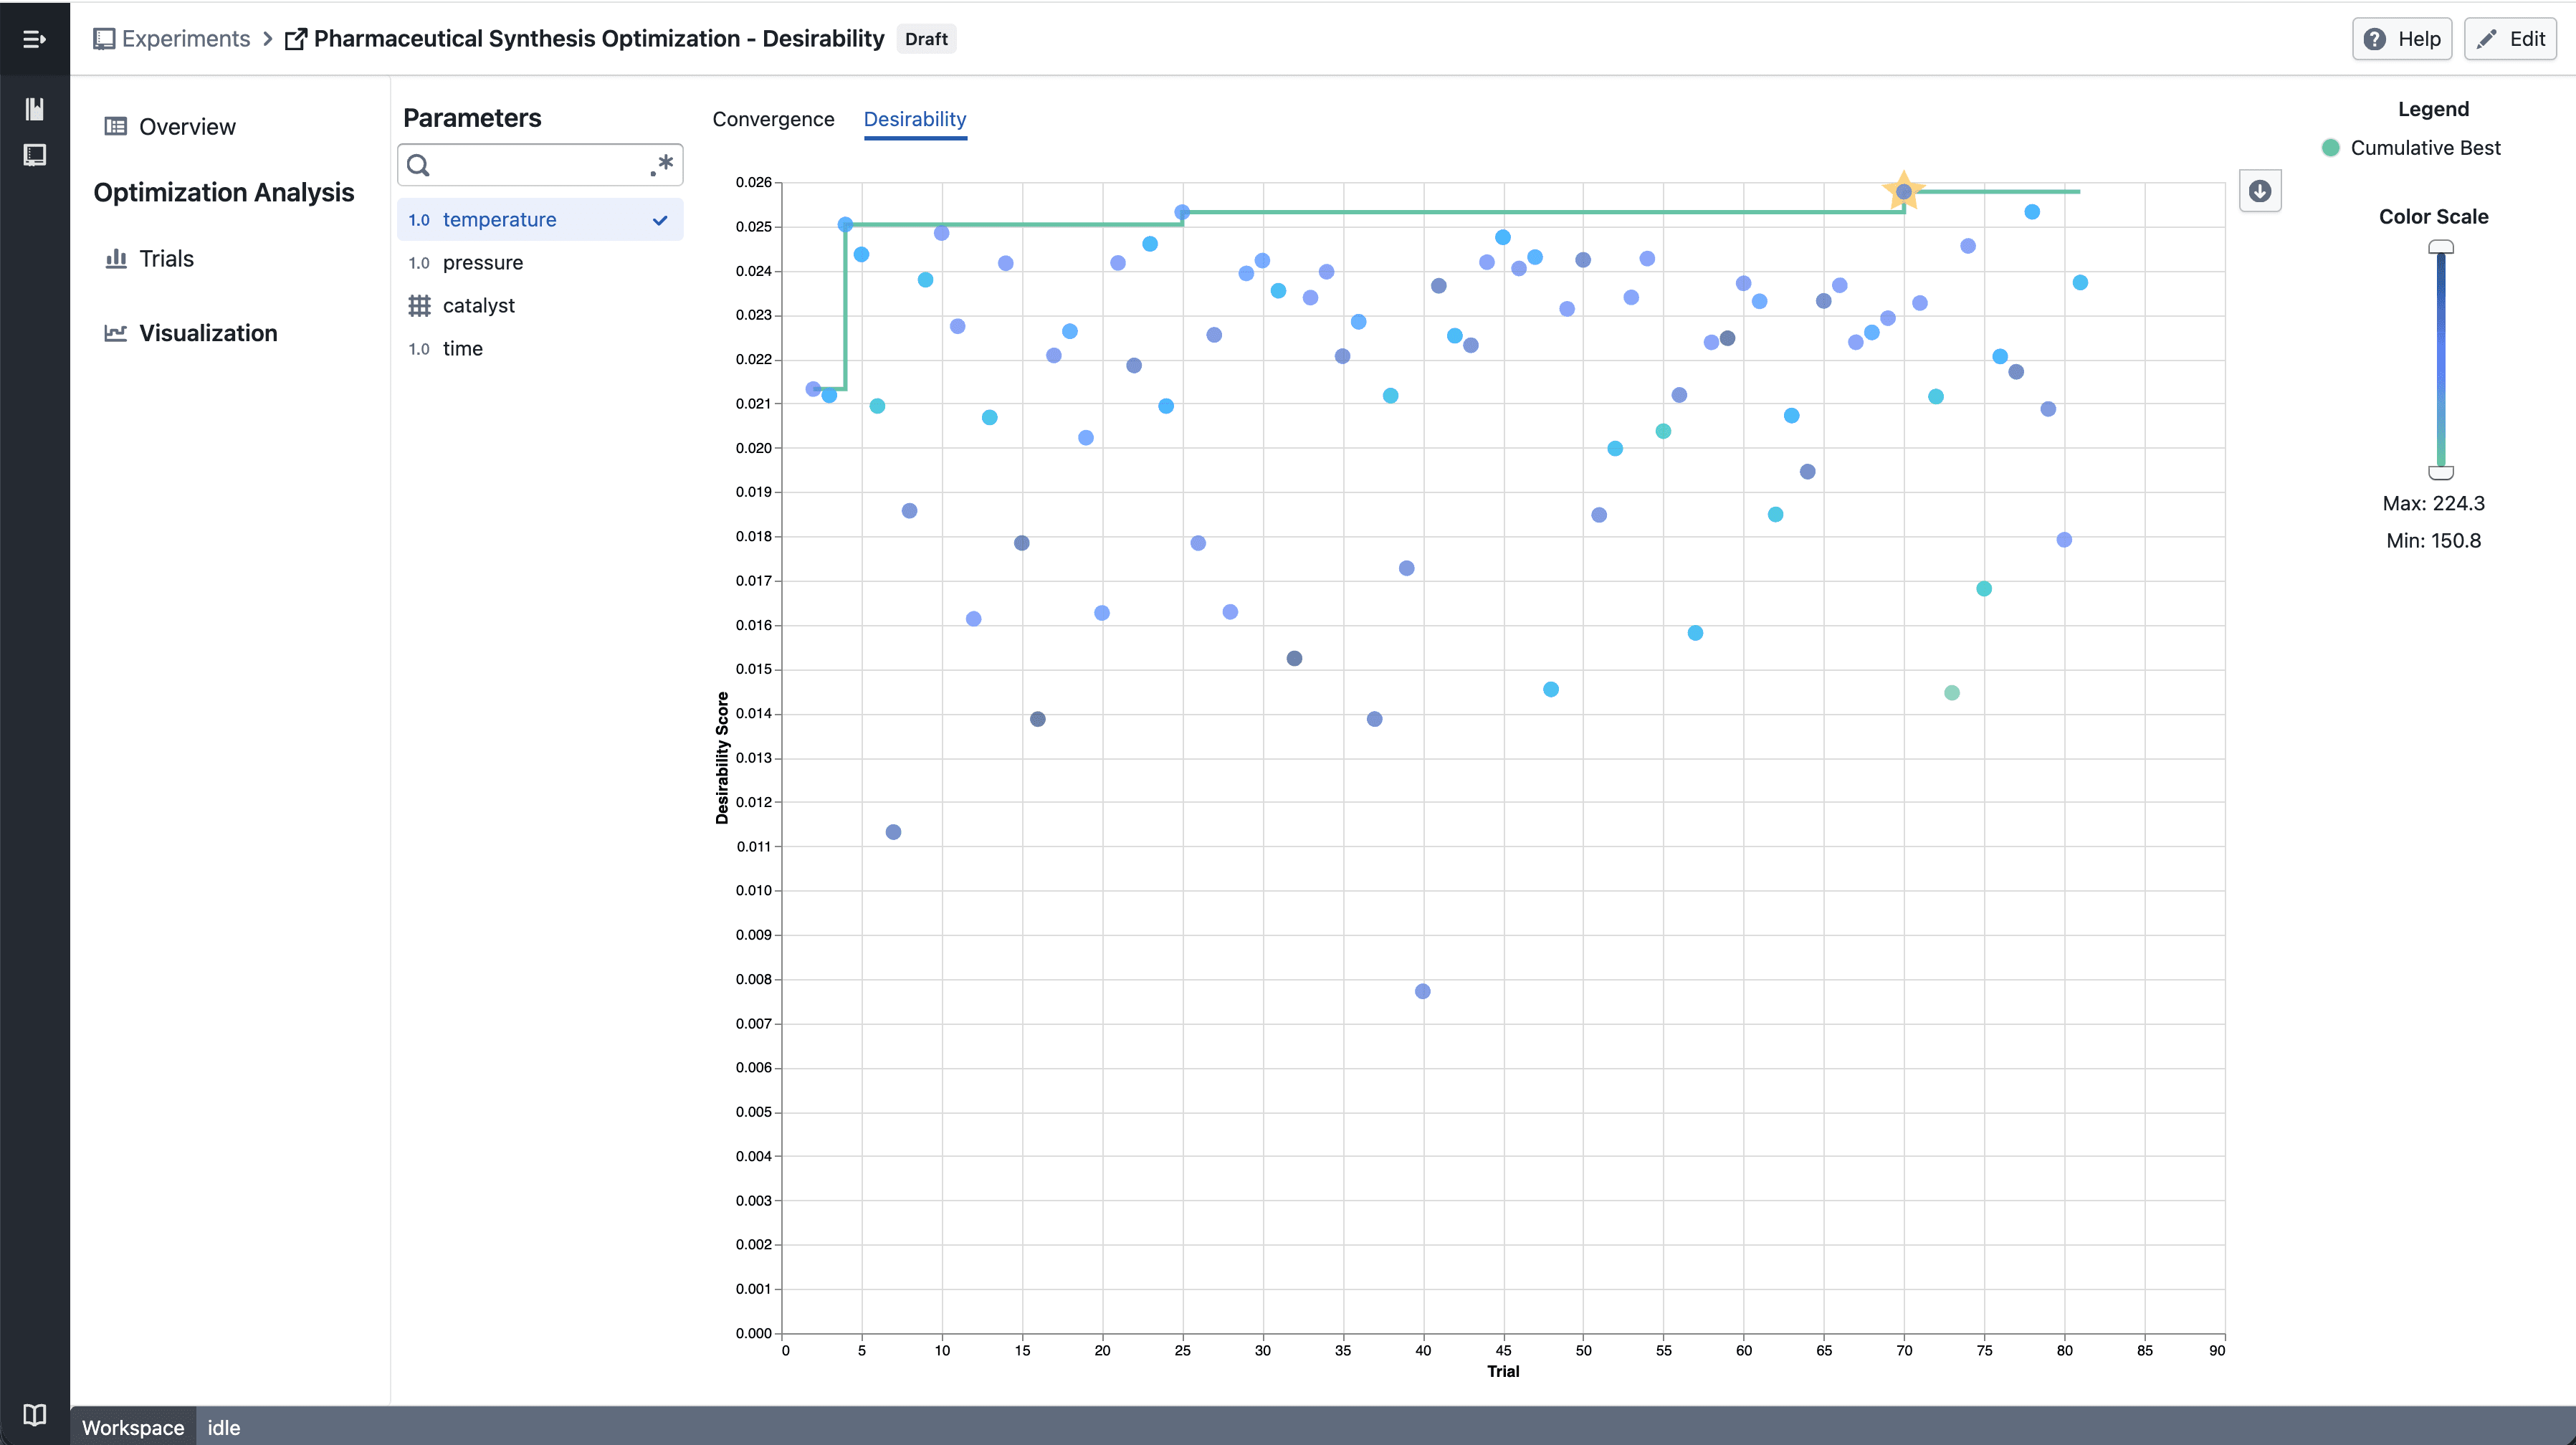
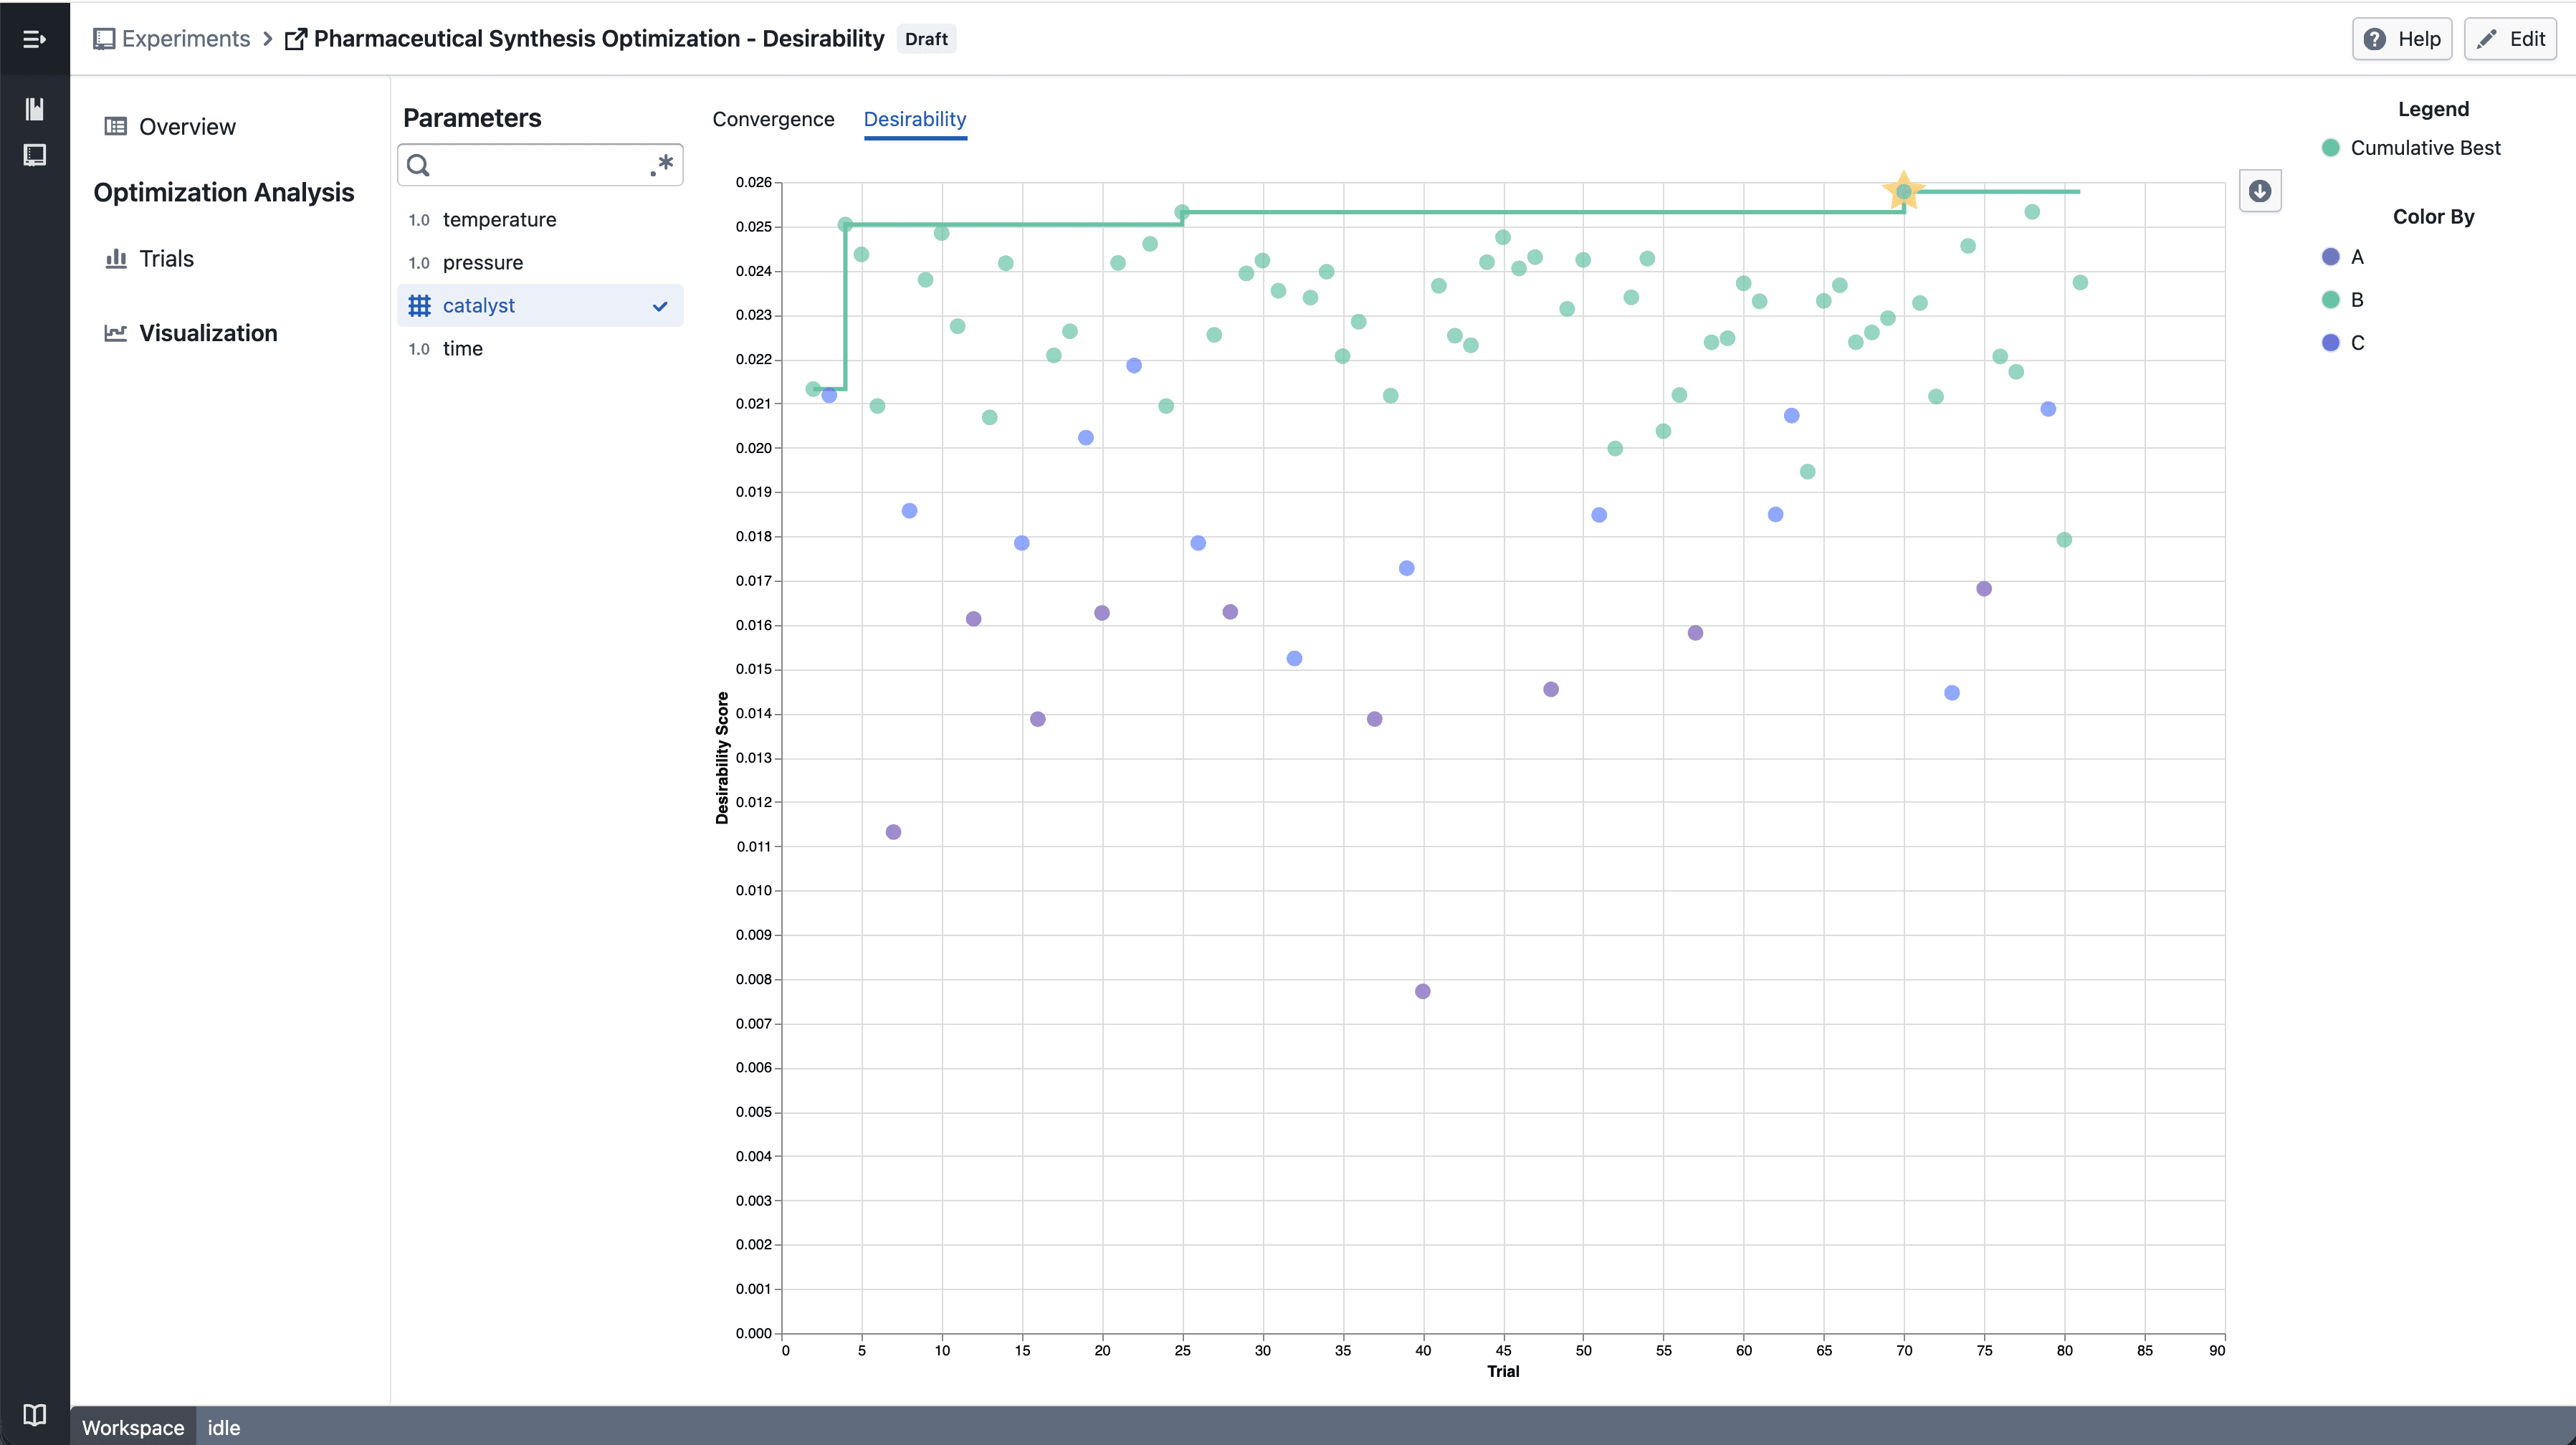
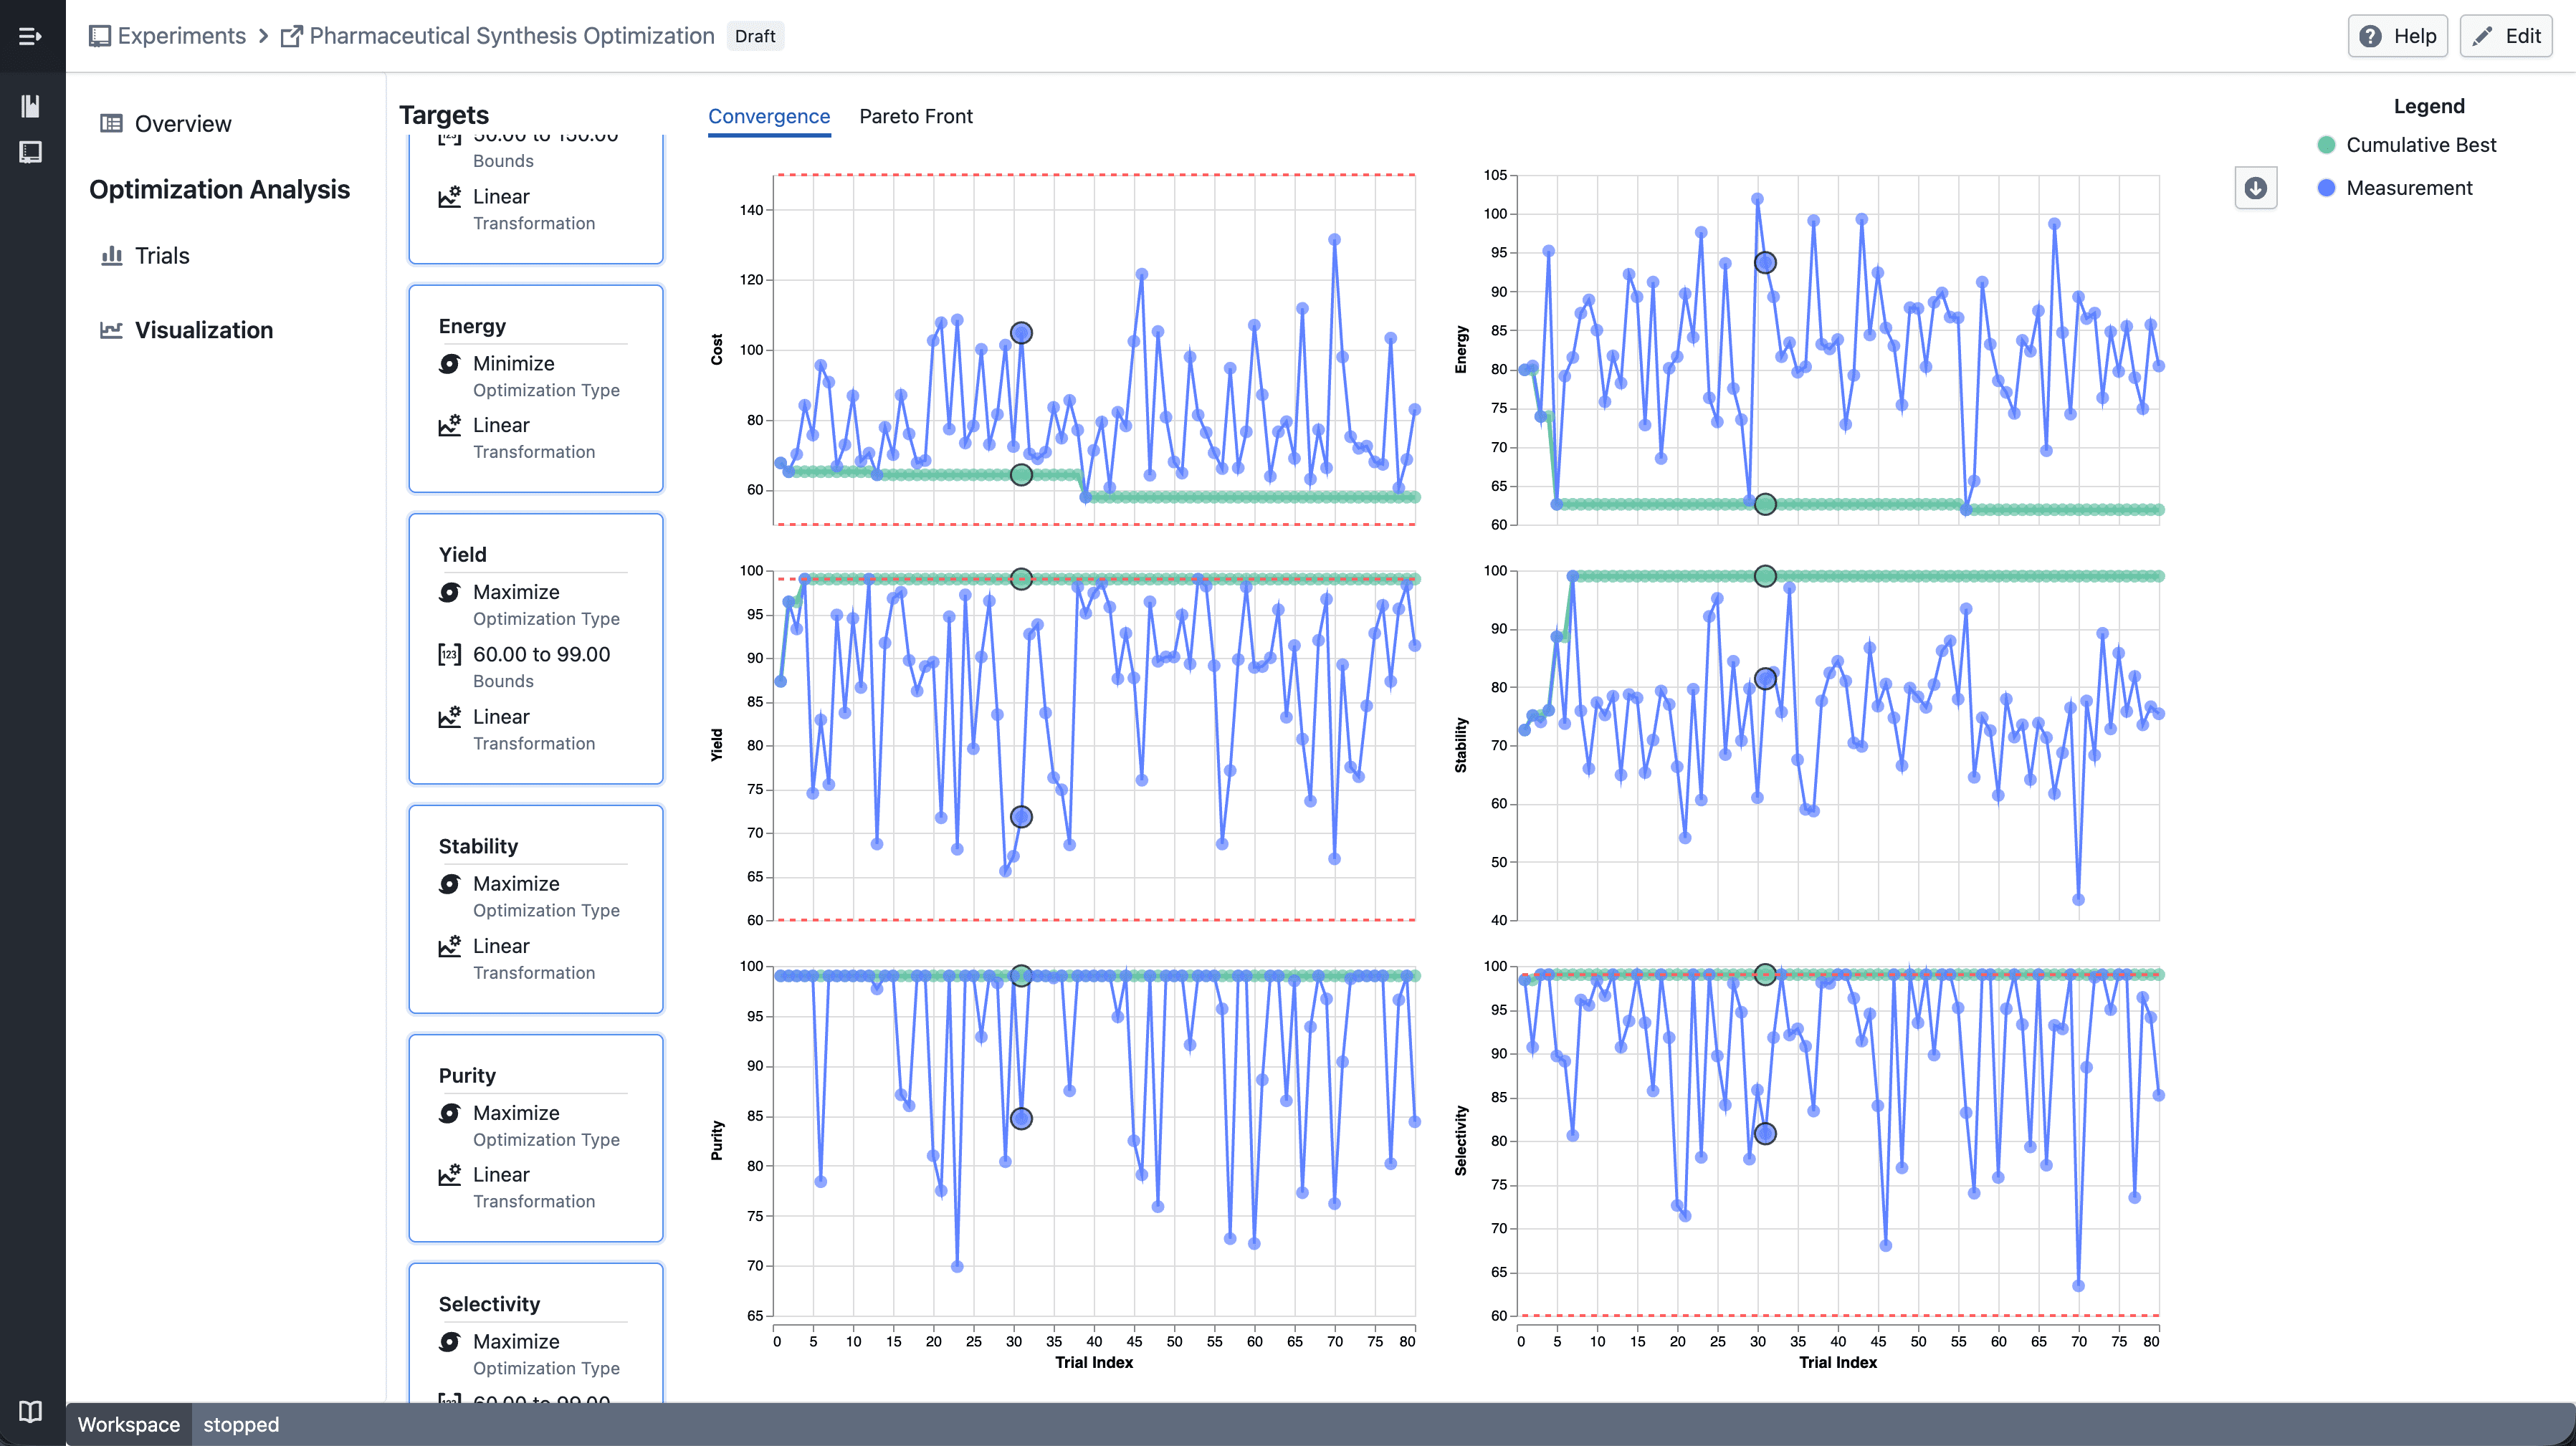
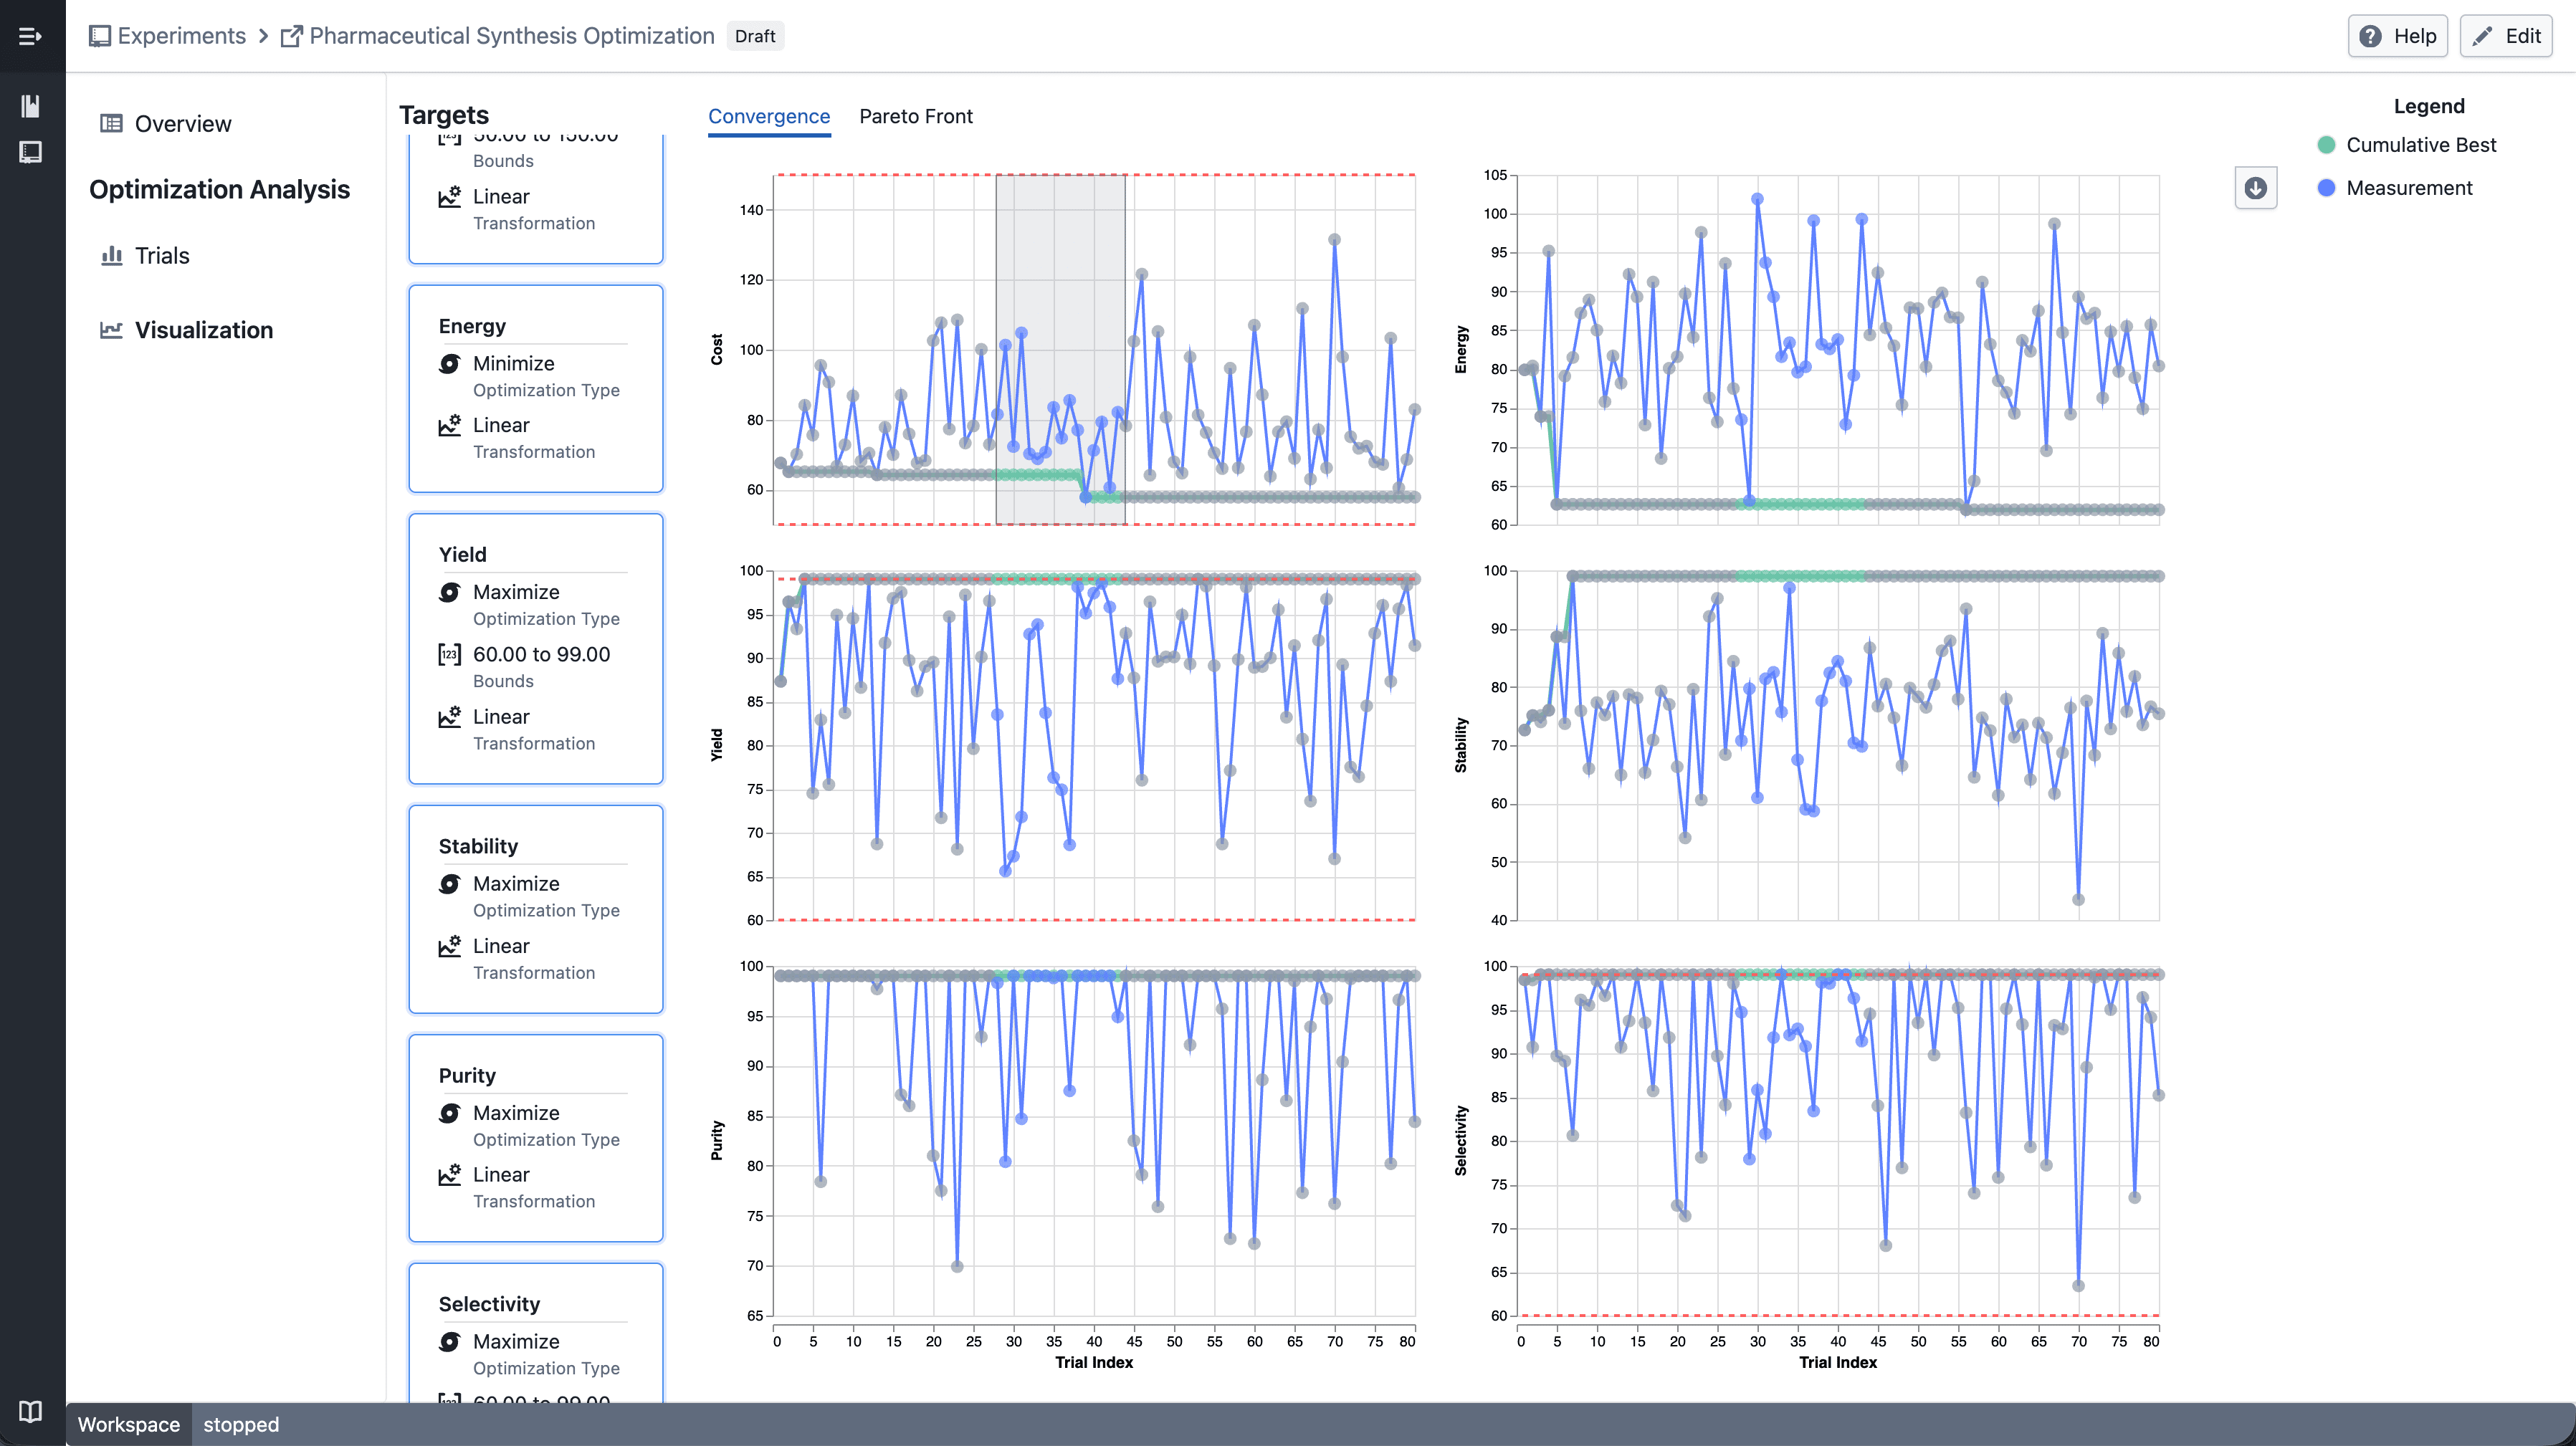
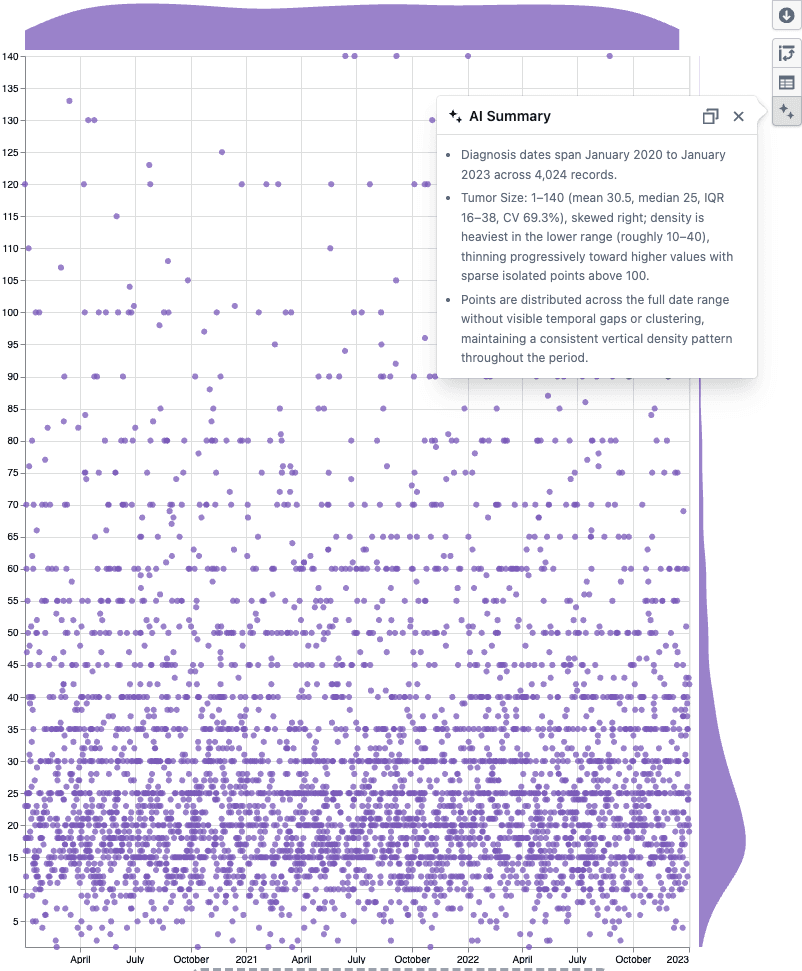
  • A vision-enabled LLM reads the plot statistics and sees the chart, then returns bullet points covering distributions, group breakdowns, data quality issues, and visual patterns like clusters or outliers
  • Hit copy to paste the summary into a report or analysis note

Notes

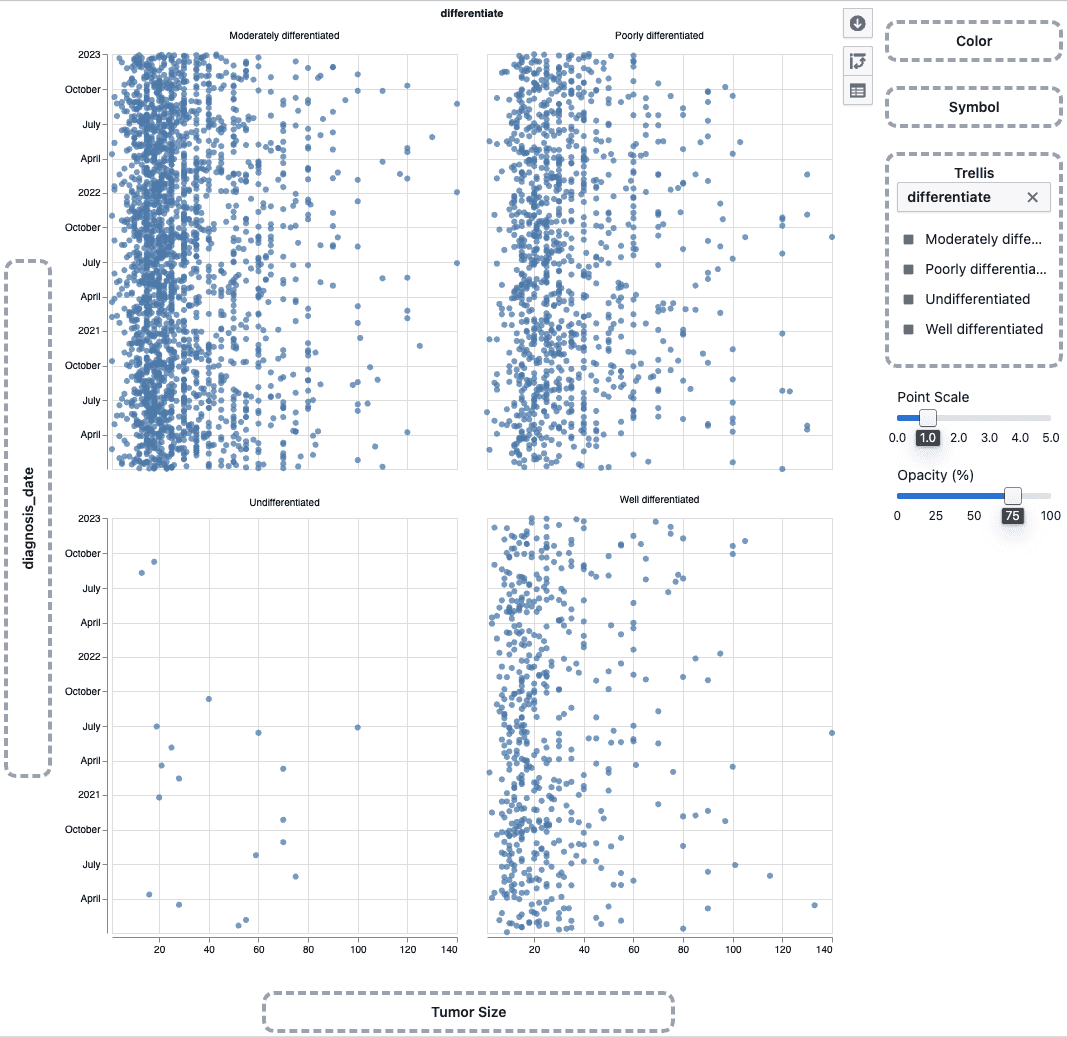
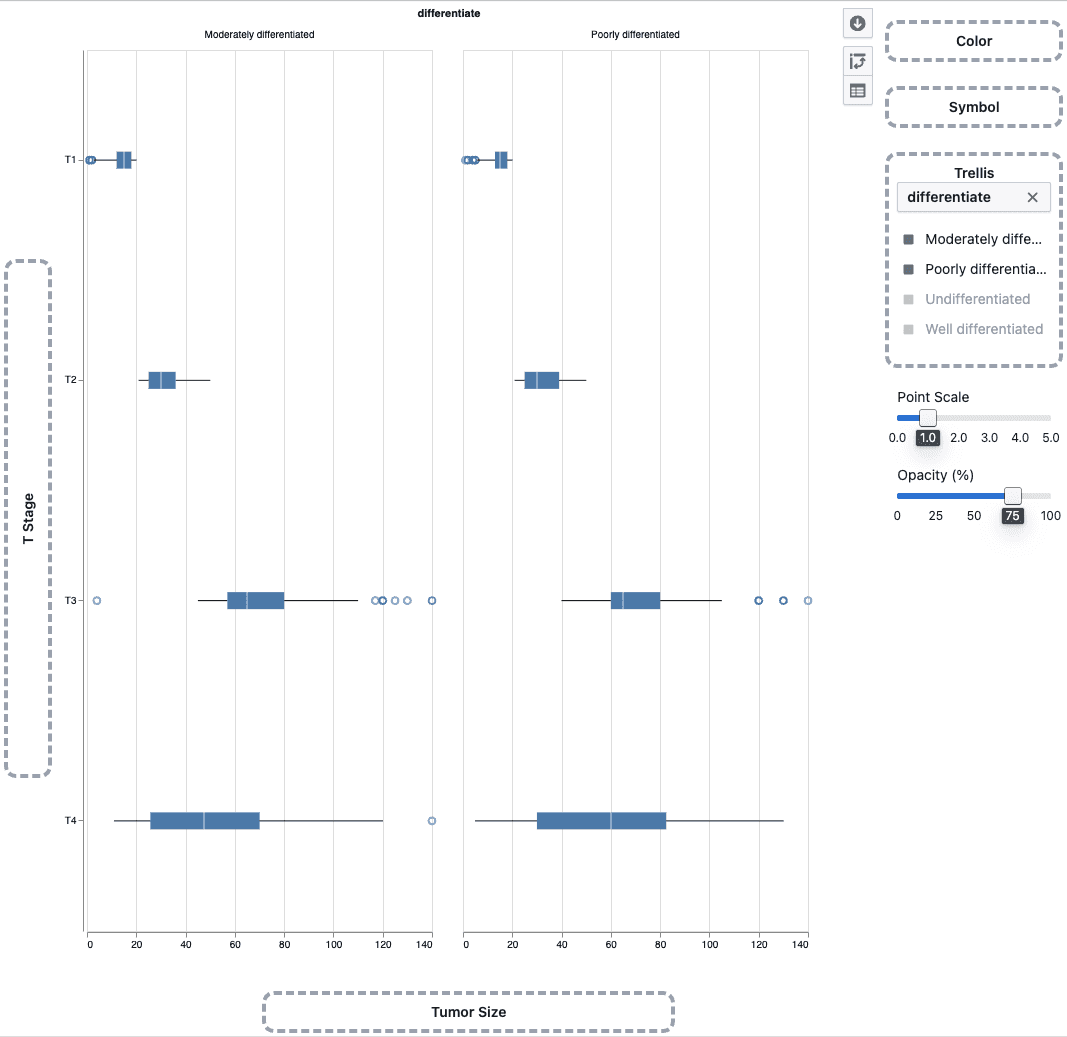
  • Works with scatter plots, box plots, and heatmaps
  • The summary is factual only — the LLM does not assess or make recommendations
  • If you notice any unexpected behavior, please share steps to reproduce

Desirability Convergence Chart

New desirability convergence chart for tracking optimization progress across experiment trials.

What's included

How it works

Numerical Parameter - select parameter

  • Select a numerical parameter from the parameter sidebar to color data points by that parameter's value
  • A continuous color scale shows how parameter values relate to desirability scores across trials
  • The best so far line tracks the highest desirability achieved up to each trial

Categorical Parameter - select parameter

  • Select a categorical parameter to color data points by category
  • A discrete color legend identifies each category value

Notes

  • The convergence chart is available under the Desirability tab in the Visualization section
  • Chart interactions and layout may continue to evolve during the beta phase
  • If you notice any unexpected behavior, please share steps to reproduce

Trellis plots in Experiment Visualization Convergence

Split convergence plot into a multi-panel grid when multiple targets are selected.

What's included

How it works

Trellis convergence plot

  • Select multiple targets from the target sidebar
  • The convergence plot automatically splits into a grid — one panel per target
  • Each panel shares the same x-axis (iteration index) but has an independent y-axis scale

Trellis - select point

  • Click a data point to highlight the corresponding trial across all panels

Trellis - draw point

  • Shift-drag to draw a brush selection across panels
  • Points outside the selection are dimmed
  • Up to 6 targets can be displayed at a time

Notes

  • Single target selection continues to show the standard convergence plot
  • Trellis layout and interactions may continue to evolve during the beta phase
  • If you notice any unexpected behavior, please share steps to reproduce

Trellis plots in Plot Builder

Split scatter plots and box plots into a multi-panel grid by any categorical column to compare patterns across groups side by side.

What's included

How it works

Trellis scatter plot

  • Drag a categorical column onto the Trellis drop zone in the plot sidebar
  • The plot splits into a grid of panels — one per category
  • Works with scatter plots and box plots

Trellis box plot

  • Use the trellis legend to choose which categories to display
  • Up to 4 panels can be shown at a time

Notes

  • Heatmaps do not support trellis
  • Trellis behavior may continue to evolve during the beta phase
  • If you notice any unexpected behavior, please share steps to reproduce