
12 posts tagged with "Studies"

View All Tags

Add sorting to statistic table

Statistics tables now support column sorting to make it easier to compare and analyze values.

What’s included

Column sorting in statistics tables

On hover

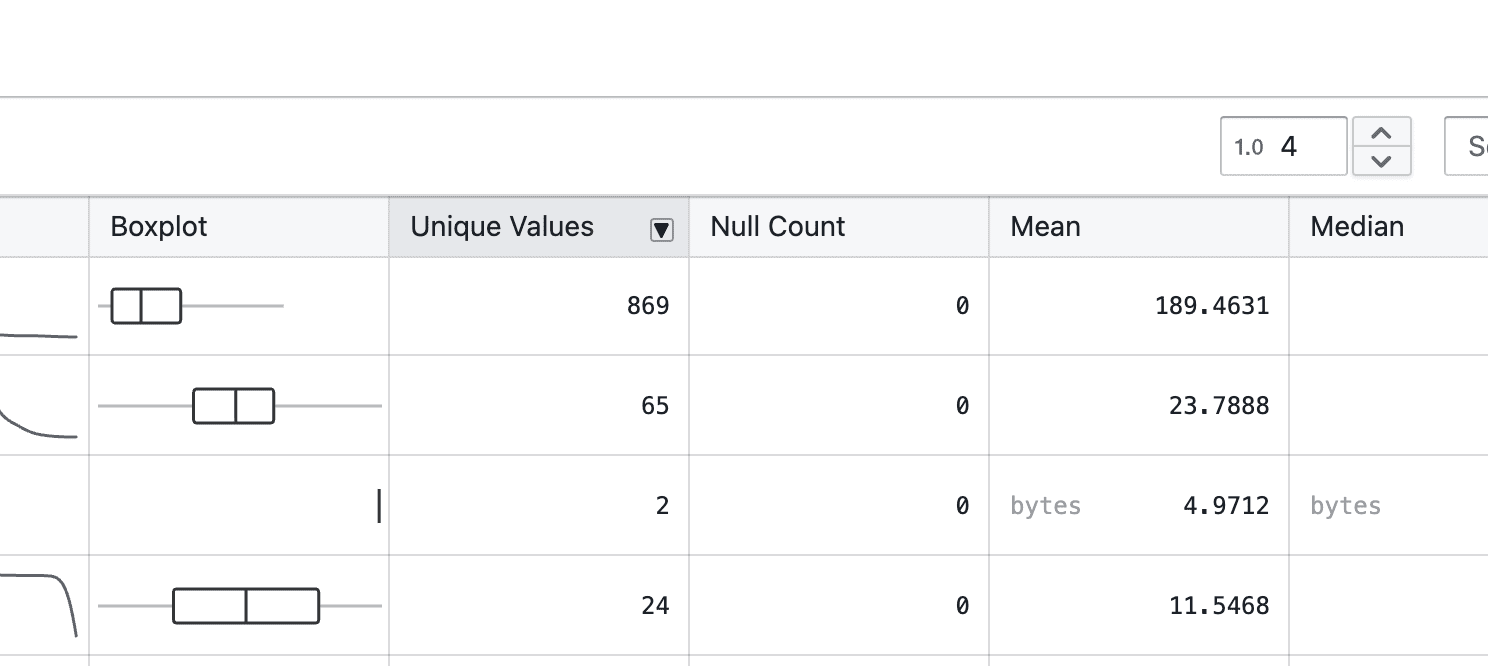
  • Hover over a column header to reveal the arrow-down icon

On click

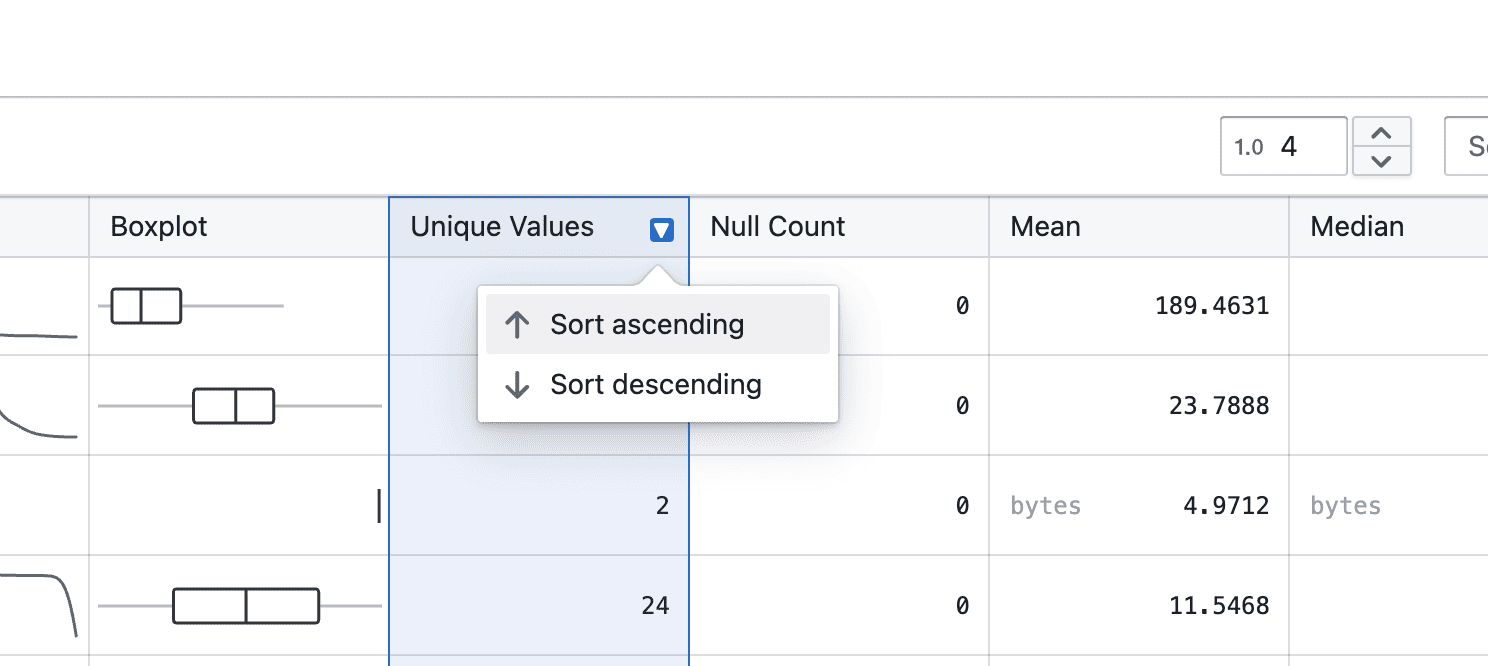
  • Click the arrow-down icon to choose ascending or descending order

Sorted

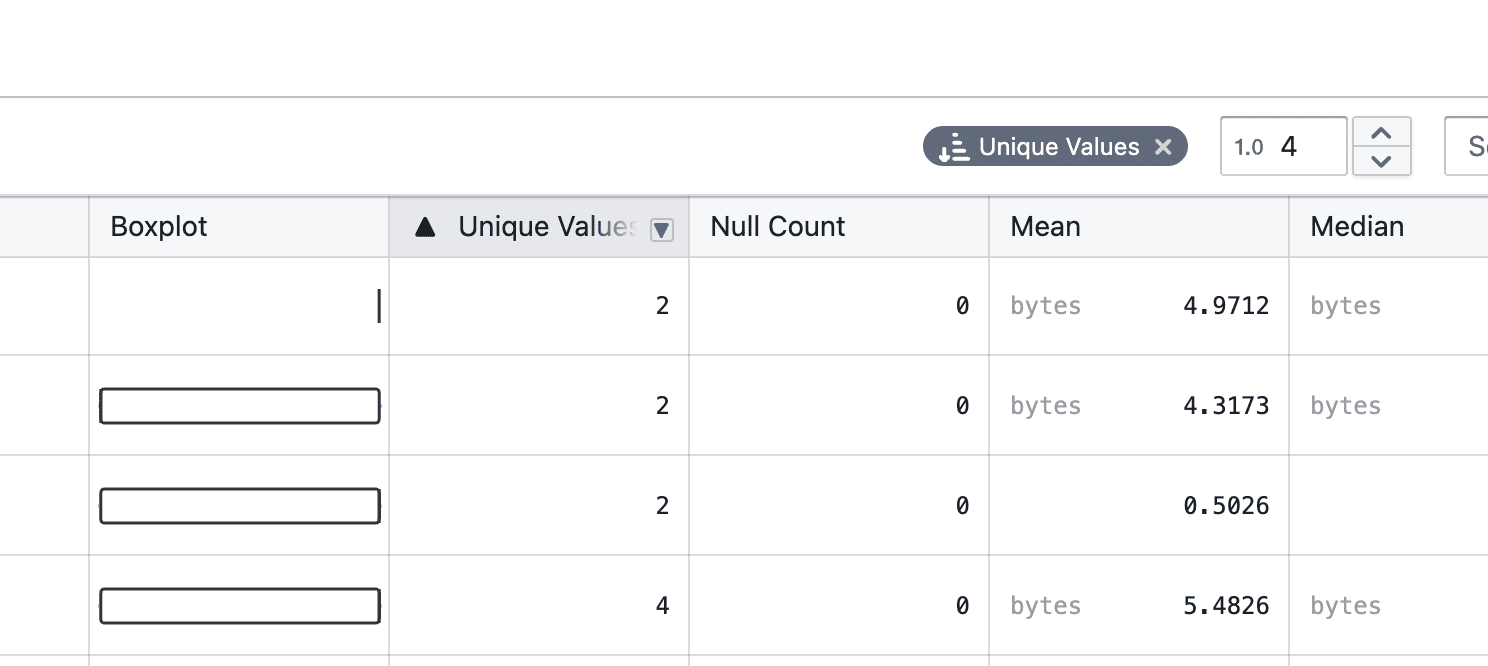
  • Once selected, the active sort order is clearly indicated, and a tag appears at the top right

On clear

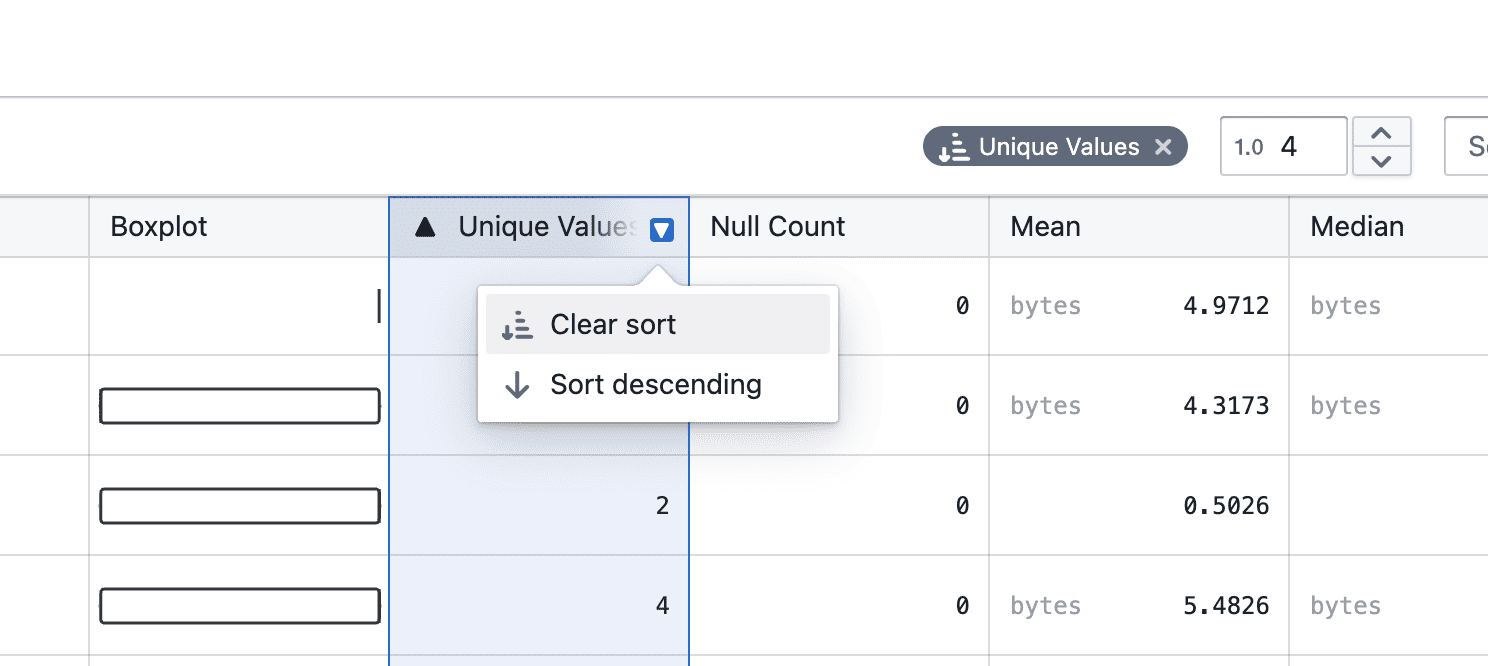
  • You can change the sort direction or clear the sort by clicking the column header again, or remove it directly from the tag

Notes

  • Sorting currently applies to the displayed statistics only
  • Additional enhancements, such as combining sorting with filters, will be added in future iterations
  • If you notice any unexpected sorting behavior, please share steps to reproduce

Kaplan-Meier survival analysis

Analyze survival data with Kaplan-Meier curves, supporting event tracking, censored observations, group comparisons, and interactive visualizations.

What's included

Survival curve visualization

Kaplan-Meier survival curves

  • Step function curves show survival probability over time
  • Tick marks indicate subjects who left the study without experiencing the event
  • Filter by time period to focus on specific study phases
  • Hover over curves to see detailed statistics at each time point

Group comparisons

Group comparison

  • Compare survival across multiple groups with color-coded curves
  • Use filters to define groups
  • Legend and tooltips identify each group

Event and censoring logic

  • Set event conditions for what you're tracking (e.g., death, disease progression)
  • Set censoring conditions for subjects who exit the study early
  • Use flexible filters to define complex criteria
  • Data not matching either condition is excluded

Multi-panel plots

Faceted survival plots

  • View multiple survival curves side-by-side in a grid
  • Split data by categories for easier comparison

Interactive tooltips

Hover over any point to see:

  • Time value and date
  • Survival probability
  • Subjects at risk
  • Events occurred
  • Subjects censored
  • Group name (when comparing groups)

Notes

  • New beta feature - behavior may change based on feedback
  • Large datasets are limited to 5000 data points for performance