Convergence plots organized by observation order
Follow optimization progress more clearly with completed results ordered as observations and predictions grouped separately.
What's included
A clearer optimization sequence
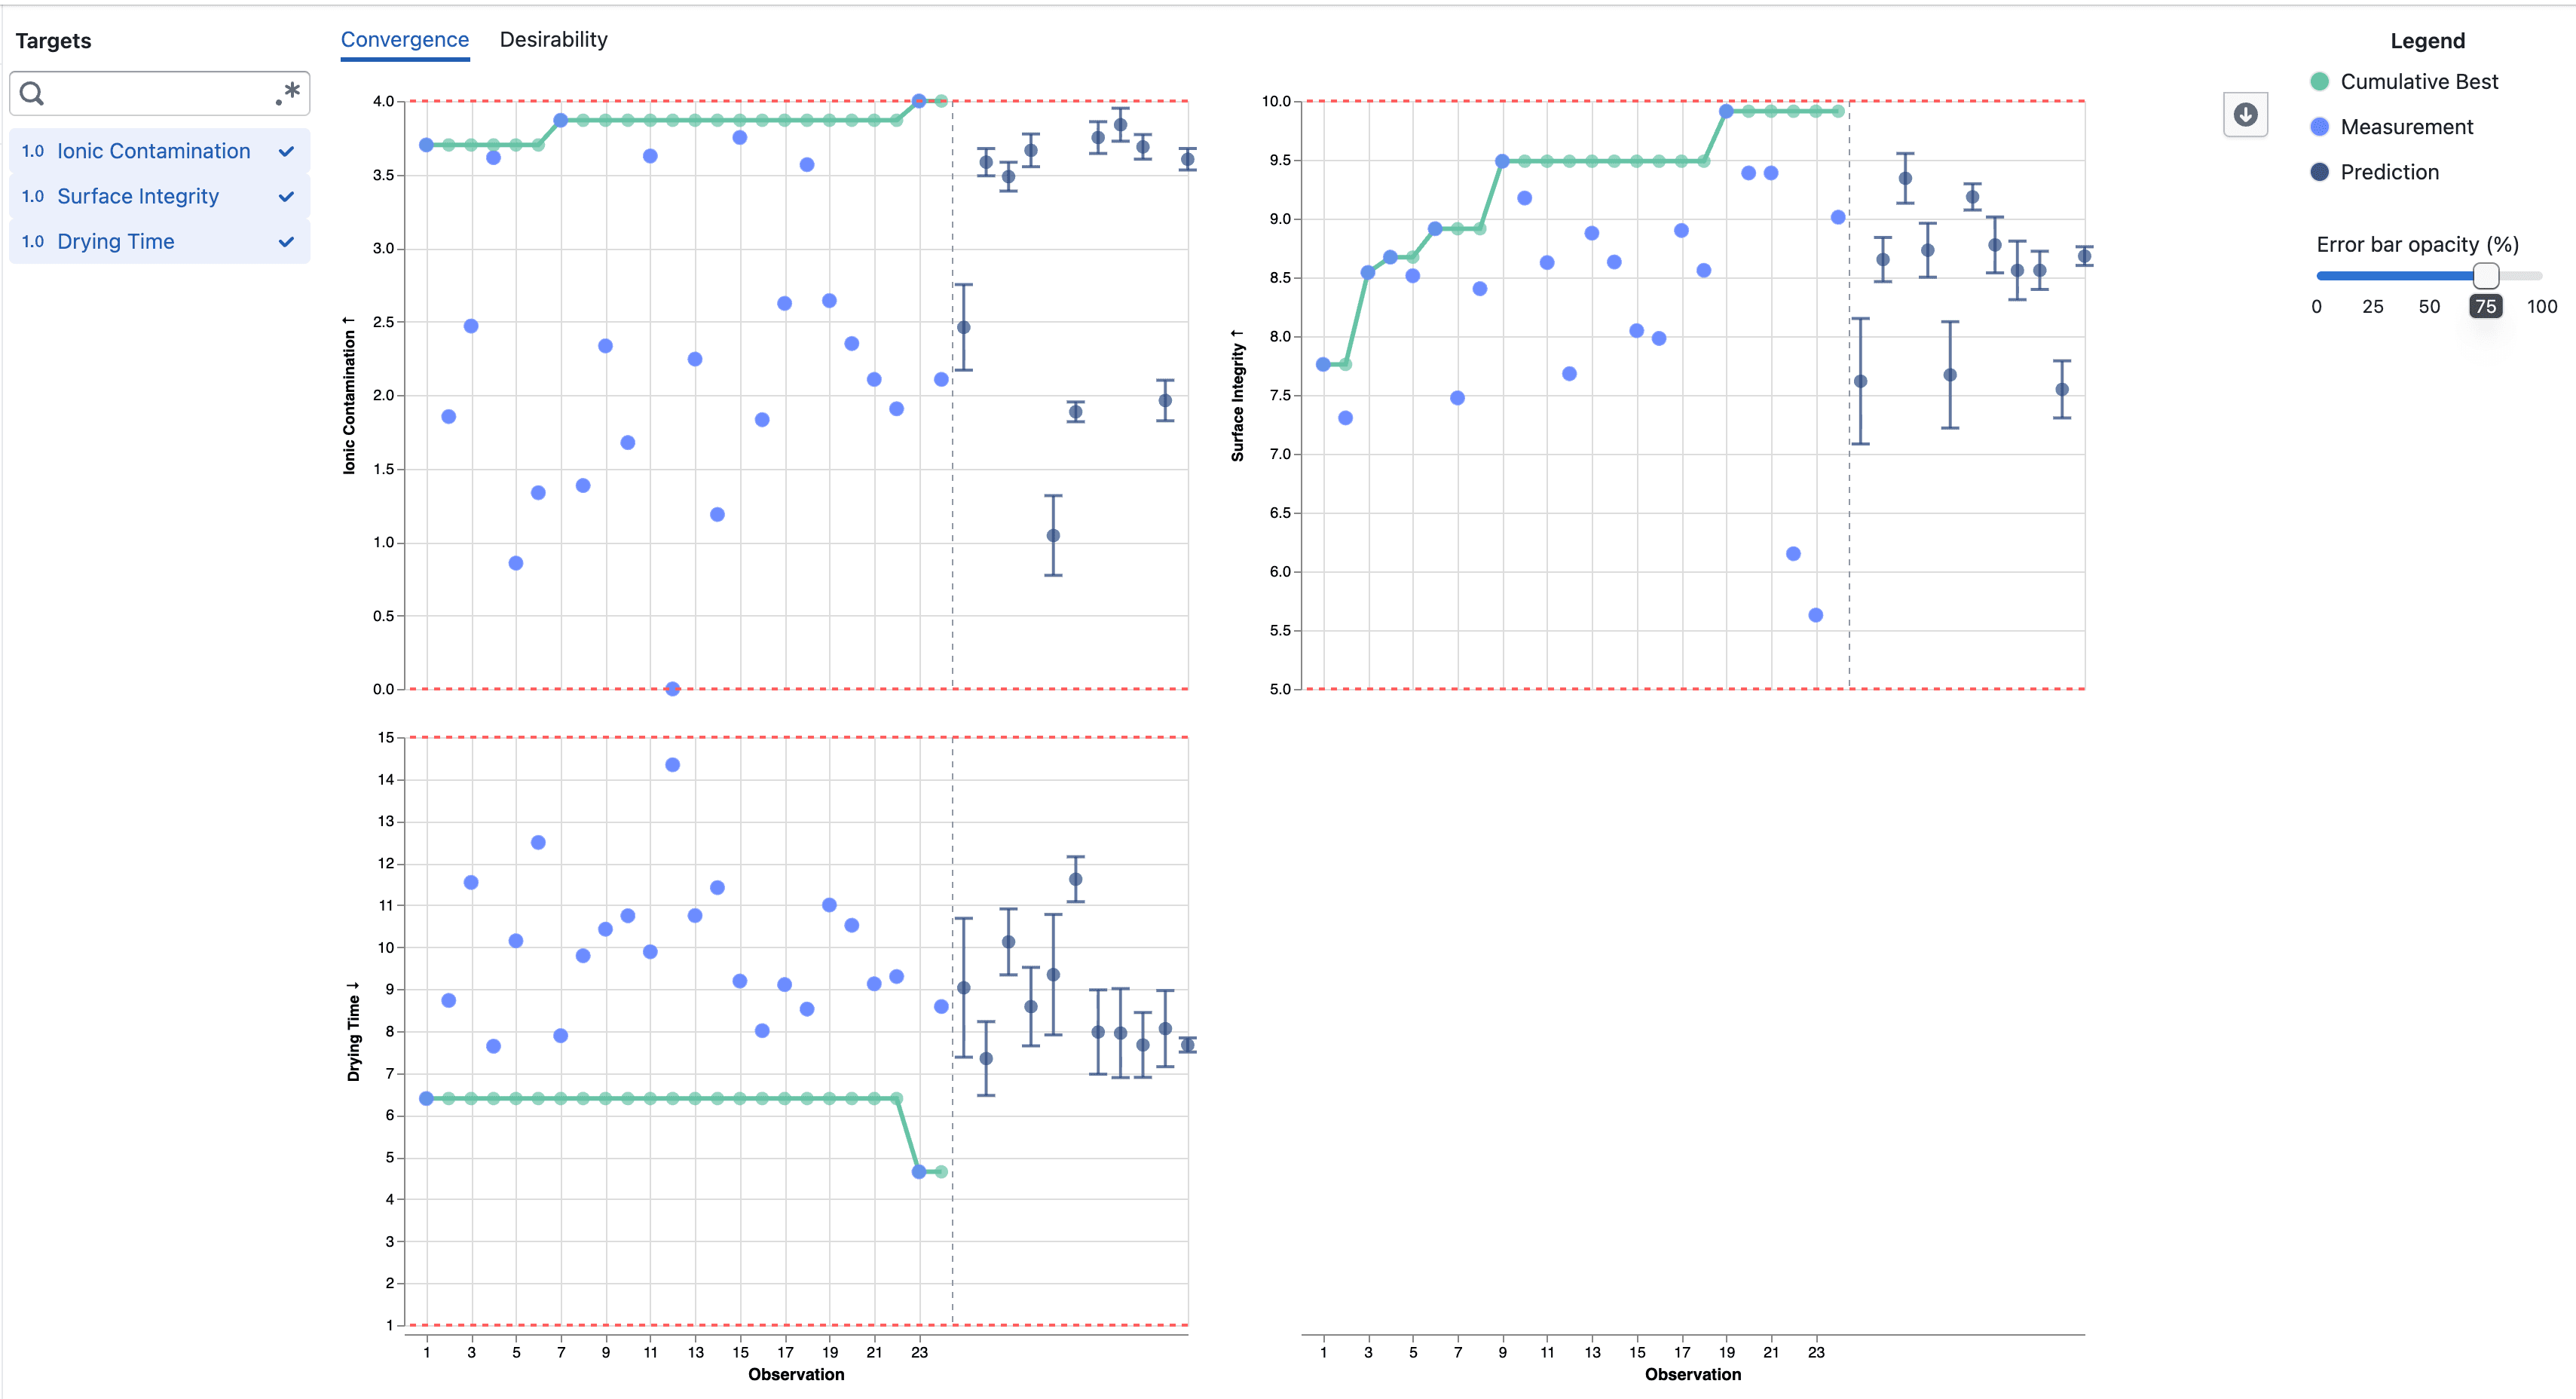
- Completed target results are numbered in completion order, without gaps from trials that did not produce a measurement
- The original trial number and completion time remain available in the point details
- Predictions for Pending and Accepted trials appear after the completed observations
- A dashed divider separates measured results from predictions across selected targets
Notes
- The observation number can differ from the original trial number when trials finish out of order or do not produce a target result
- Predictions remain model estimates and include error bars showing one posterior standard deviation above and below the mean