Understand what drives experiment predictions
Explore how each parameter influences experiment targets with SHAP-based importance visualizations.
What's included
Parameter importance
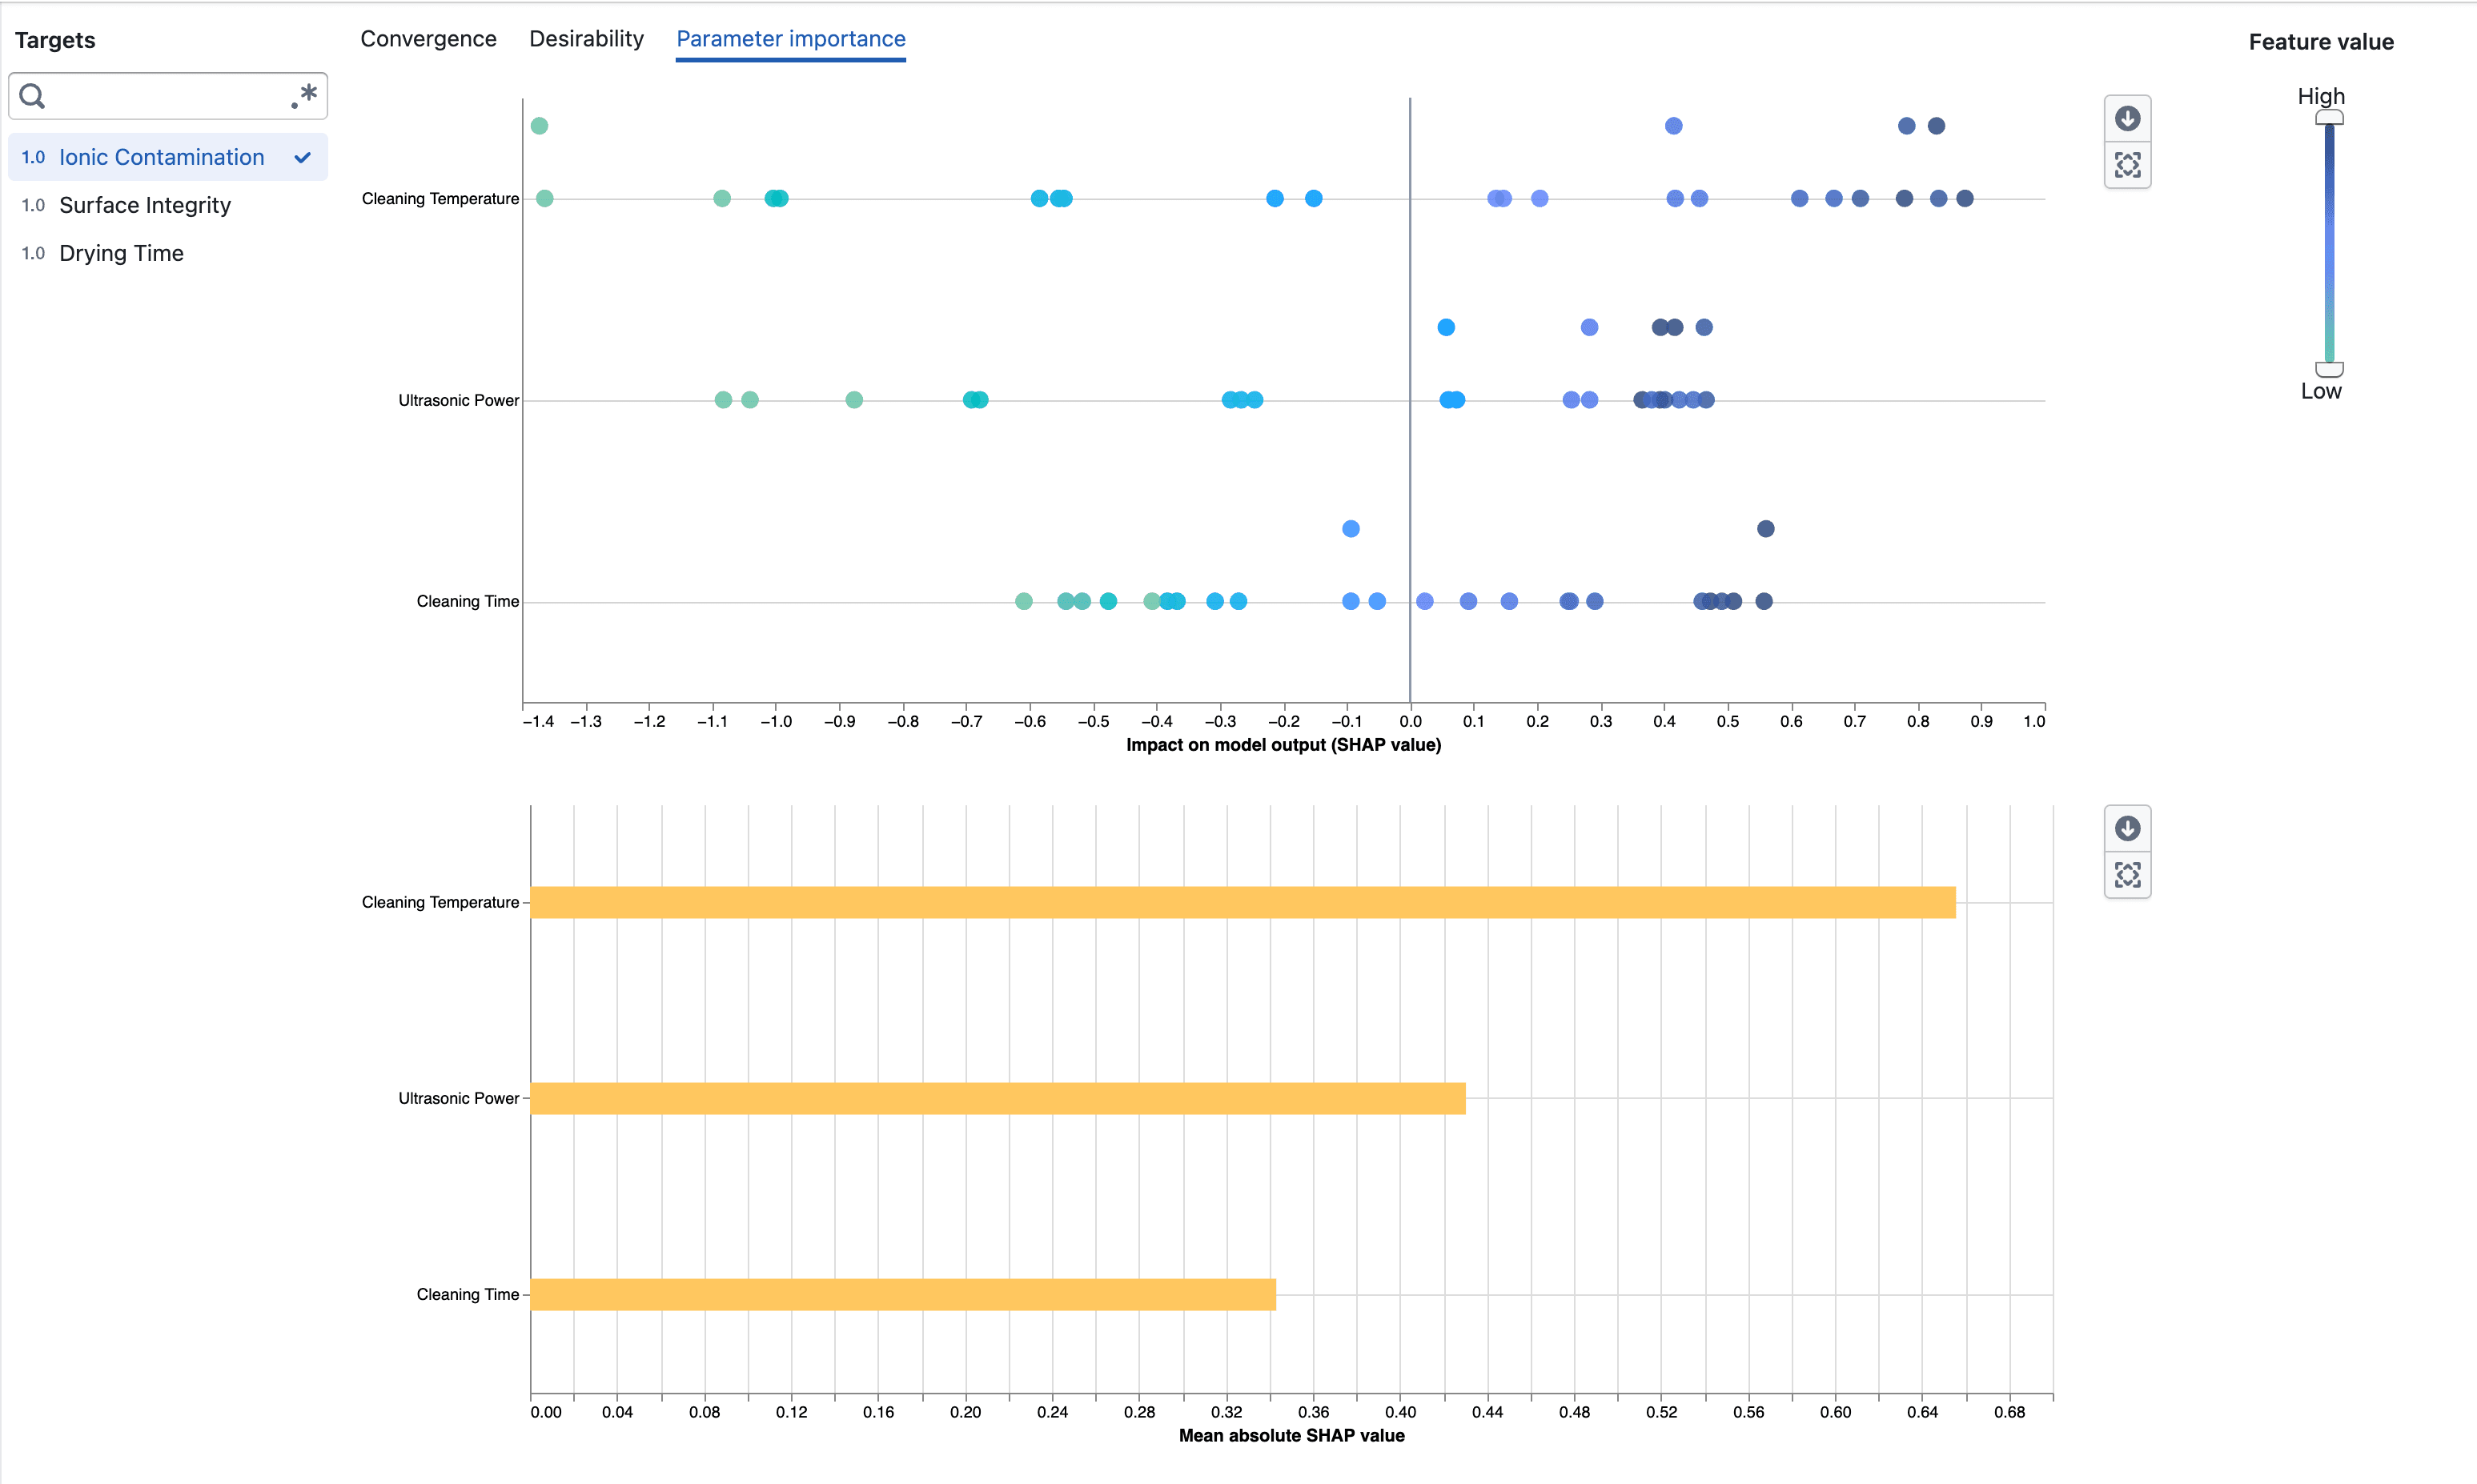
- Open Parameter importance from an experiment's Visualization page
- Select a target to inspect how its parameters contribute to the surrogate model output
- Compare parameters using their mean absolute SHAP values
- See the direction and distribution of each parameter's impact in the beeswarm plot
- Use the feature-value scale to focus on observations with low or high numeric parameter values
Notes
- Parameter importance requires enough completed measurements to fit the surrogate model
- SHAP values describe model behavior and do not imply that a parameter causes a target outcome