Results
The Results page shows what has happened in the experiment so far: how trial outcomes have progressed, and how competing targets trade off against each other. Open it from the experiment detail view under Results.
What you can analyze
Results combines completed trials with available predictions for Pending and Accepted trials. Some views depend on the experiment's objective and number of targets:
- Convergence is always available and shows how measured trial results compare with the cumulative best result over time.
- Desirability appears when the experiment uses a desirability objective. It shows how the overall desirability score changes across trials.
- Pareto front appears when the experiment has multiple targets and is not using desirability. It helps you compare trade-offs between competing outcomes.
How to use the page
Select targets or parameters
The left side of the page changes based on the active view:
- In Convergence and Pareto front, use the target list to choose which targets to display.
- In Desirability, use the parameter sidebar to choose which parameter to inspect.
Use the right toolbar
For views with a series legend, the legend controls which plotted series are visible:
- In Convergence, you can compare the cumulative best line against individual measurements and predictions for open trials.
- In Desirability, the legend controls the desirability trend.
- In Pareto front, the legend distinguishes Pareto-optimal points from dominated points.
Click legend items to show or hide them. Double-click a legend item to focus on a single series.
Reading the views
Convergence
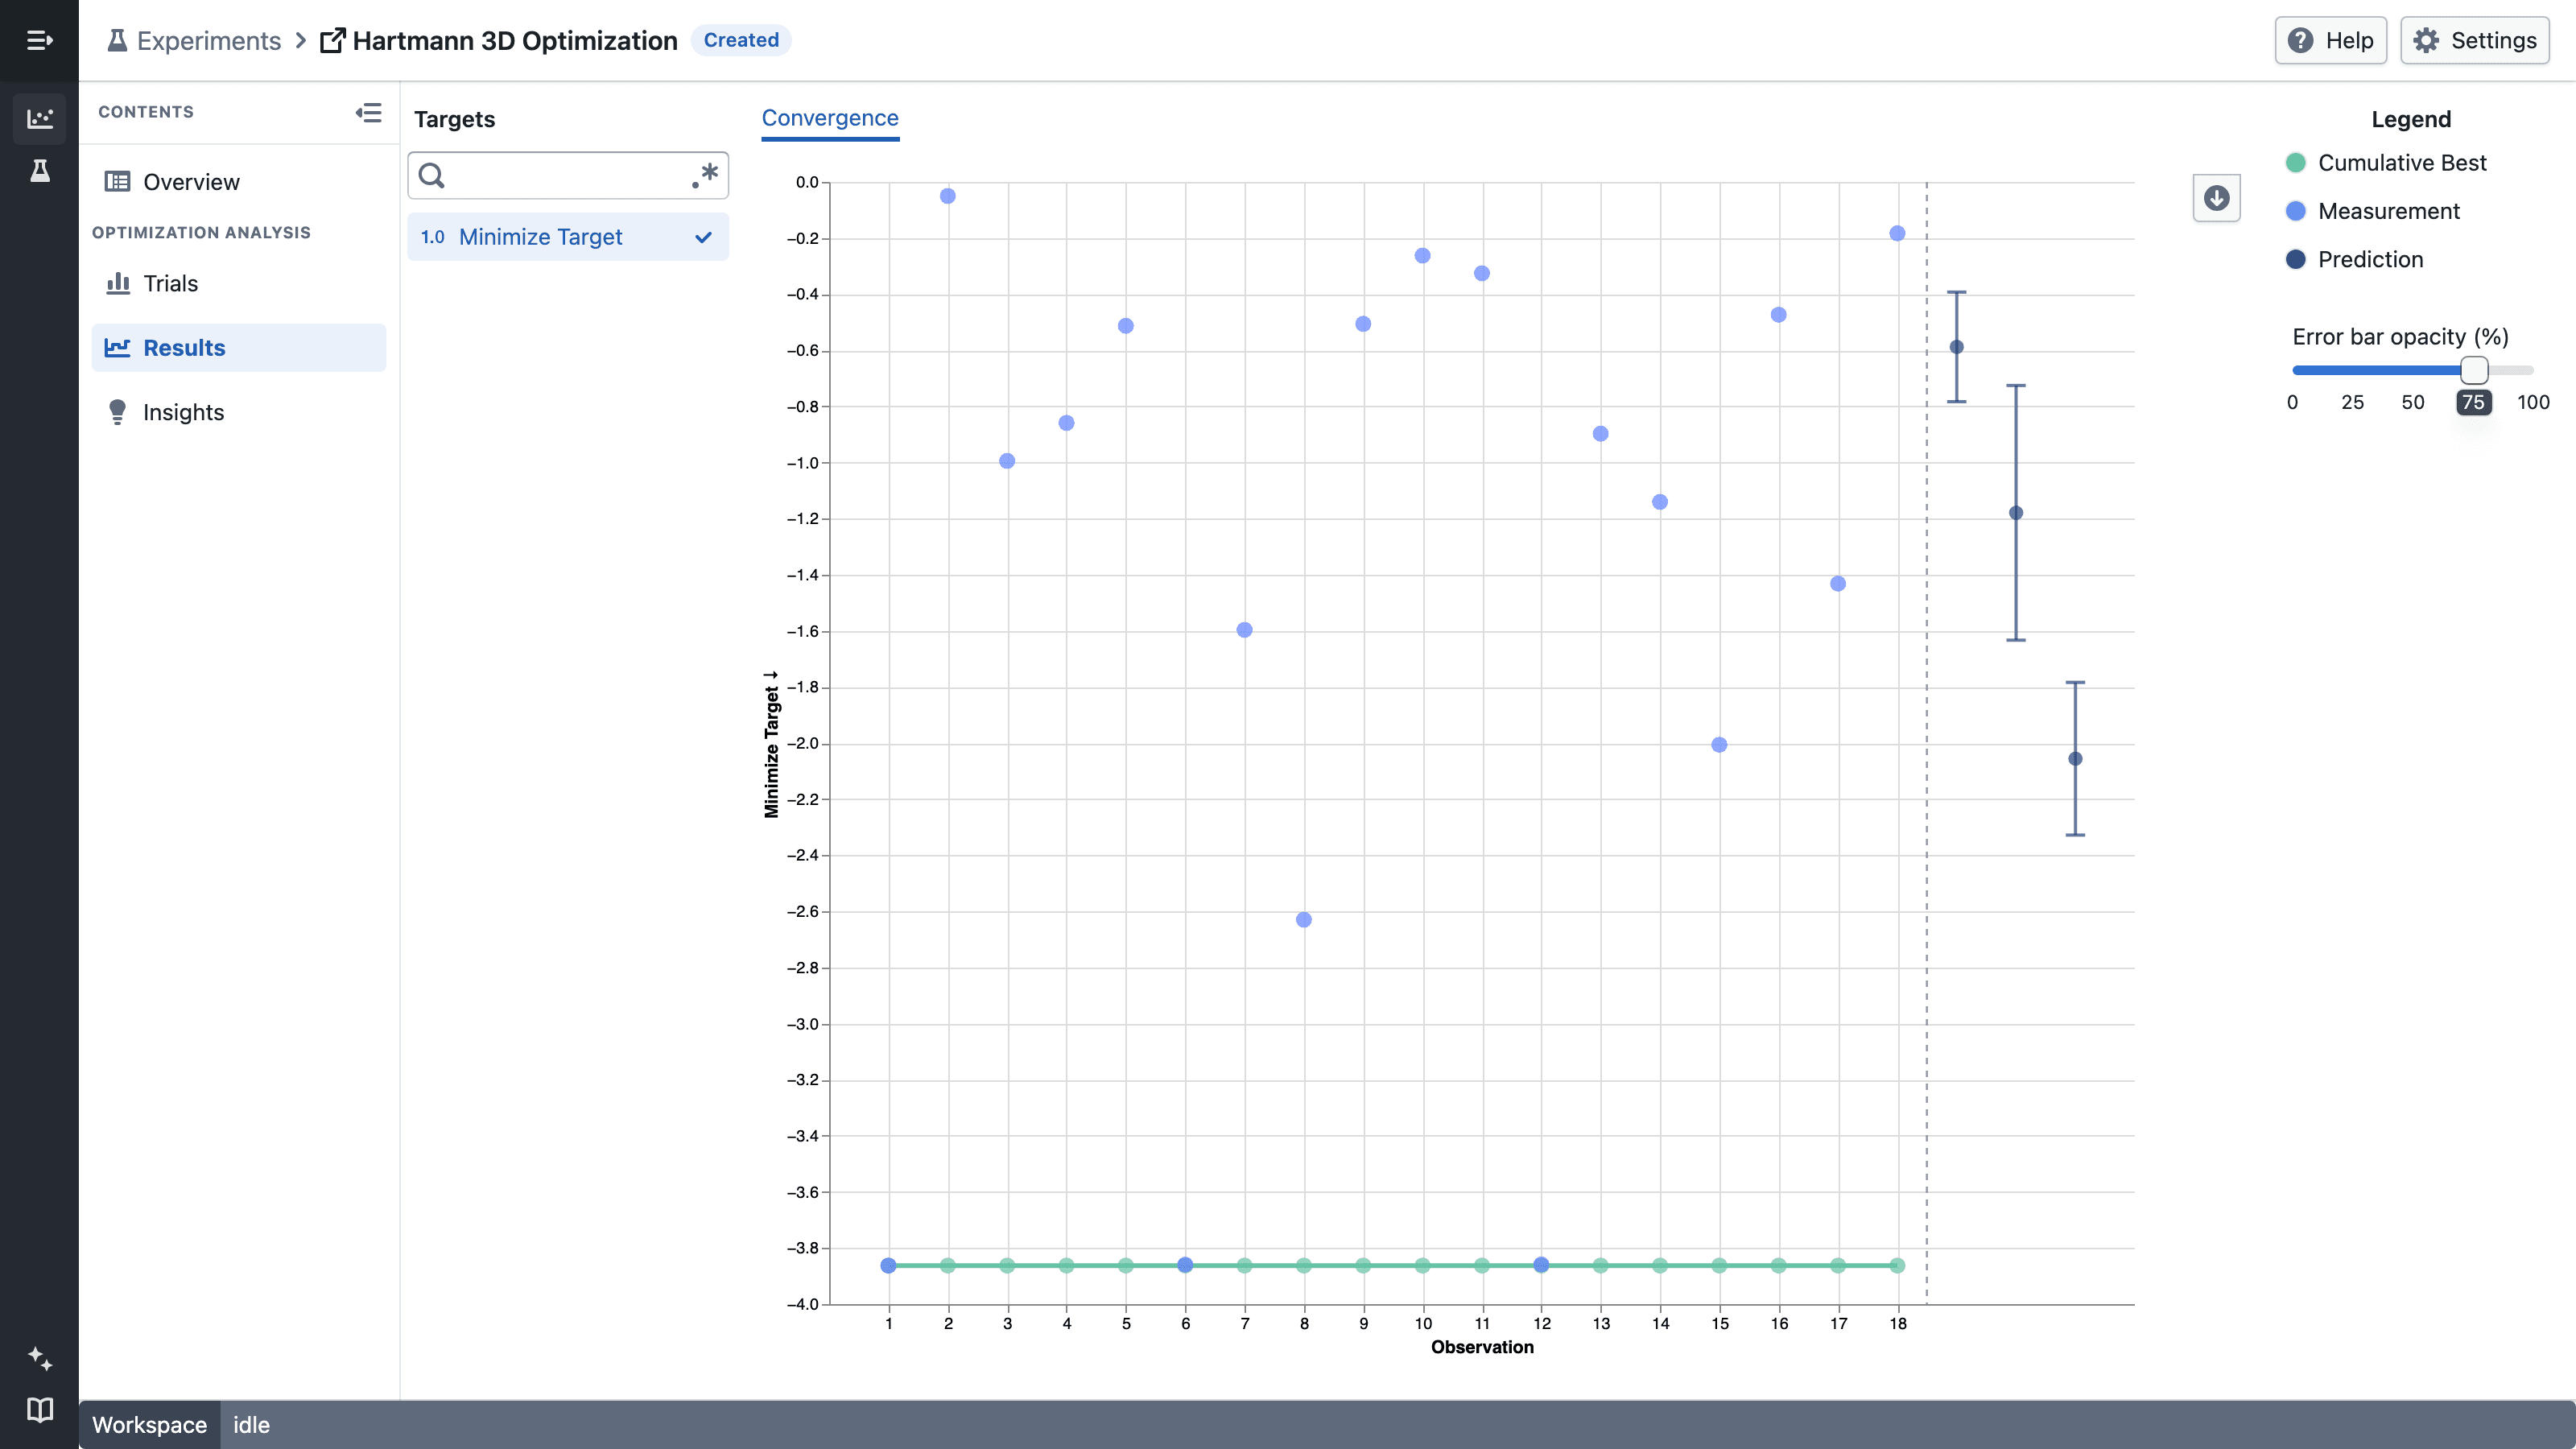
Use Convergence to answer:
- Are trial results improving over time?
- Has the experiment already found a strong region?
- Are recent measurements still moving the best-so-far result?
- What target values does BayBE predict for Pending and Accepted trials, and how uncertain are those predictions?
Predictions appear as points with error bars on the same target axis as completed measurements. The point is the posterior mean. The error bar extends from mean − std to mean + std, where std is the posterior standard deviation. These bounds describe model uncertainty; they are not observed minimum and maximum values or a confidence interval.
The x-axis numbers completed target results as observations in the order they were completed. Trials that do not produce a result for the selected target do not leave gaps. When multiple targets are selected, predictions begin after the largest observation count so every panel shares the same predicted section. The dashed vertical line separates completed observations from predictions. Hover over a measured point to see its original trial number and completion time.
Hover over a prediction to see its value and lower and upper bounds. Use Error bar opacity (%) in the right toolbar to make the error bars more or less prominent. Set it to 0% to hide the bars while keeping the prediction points visible.
Desirability
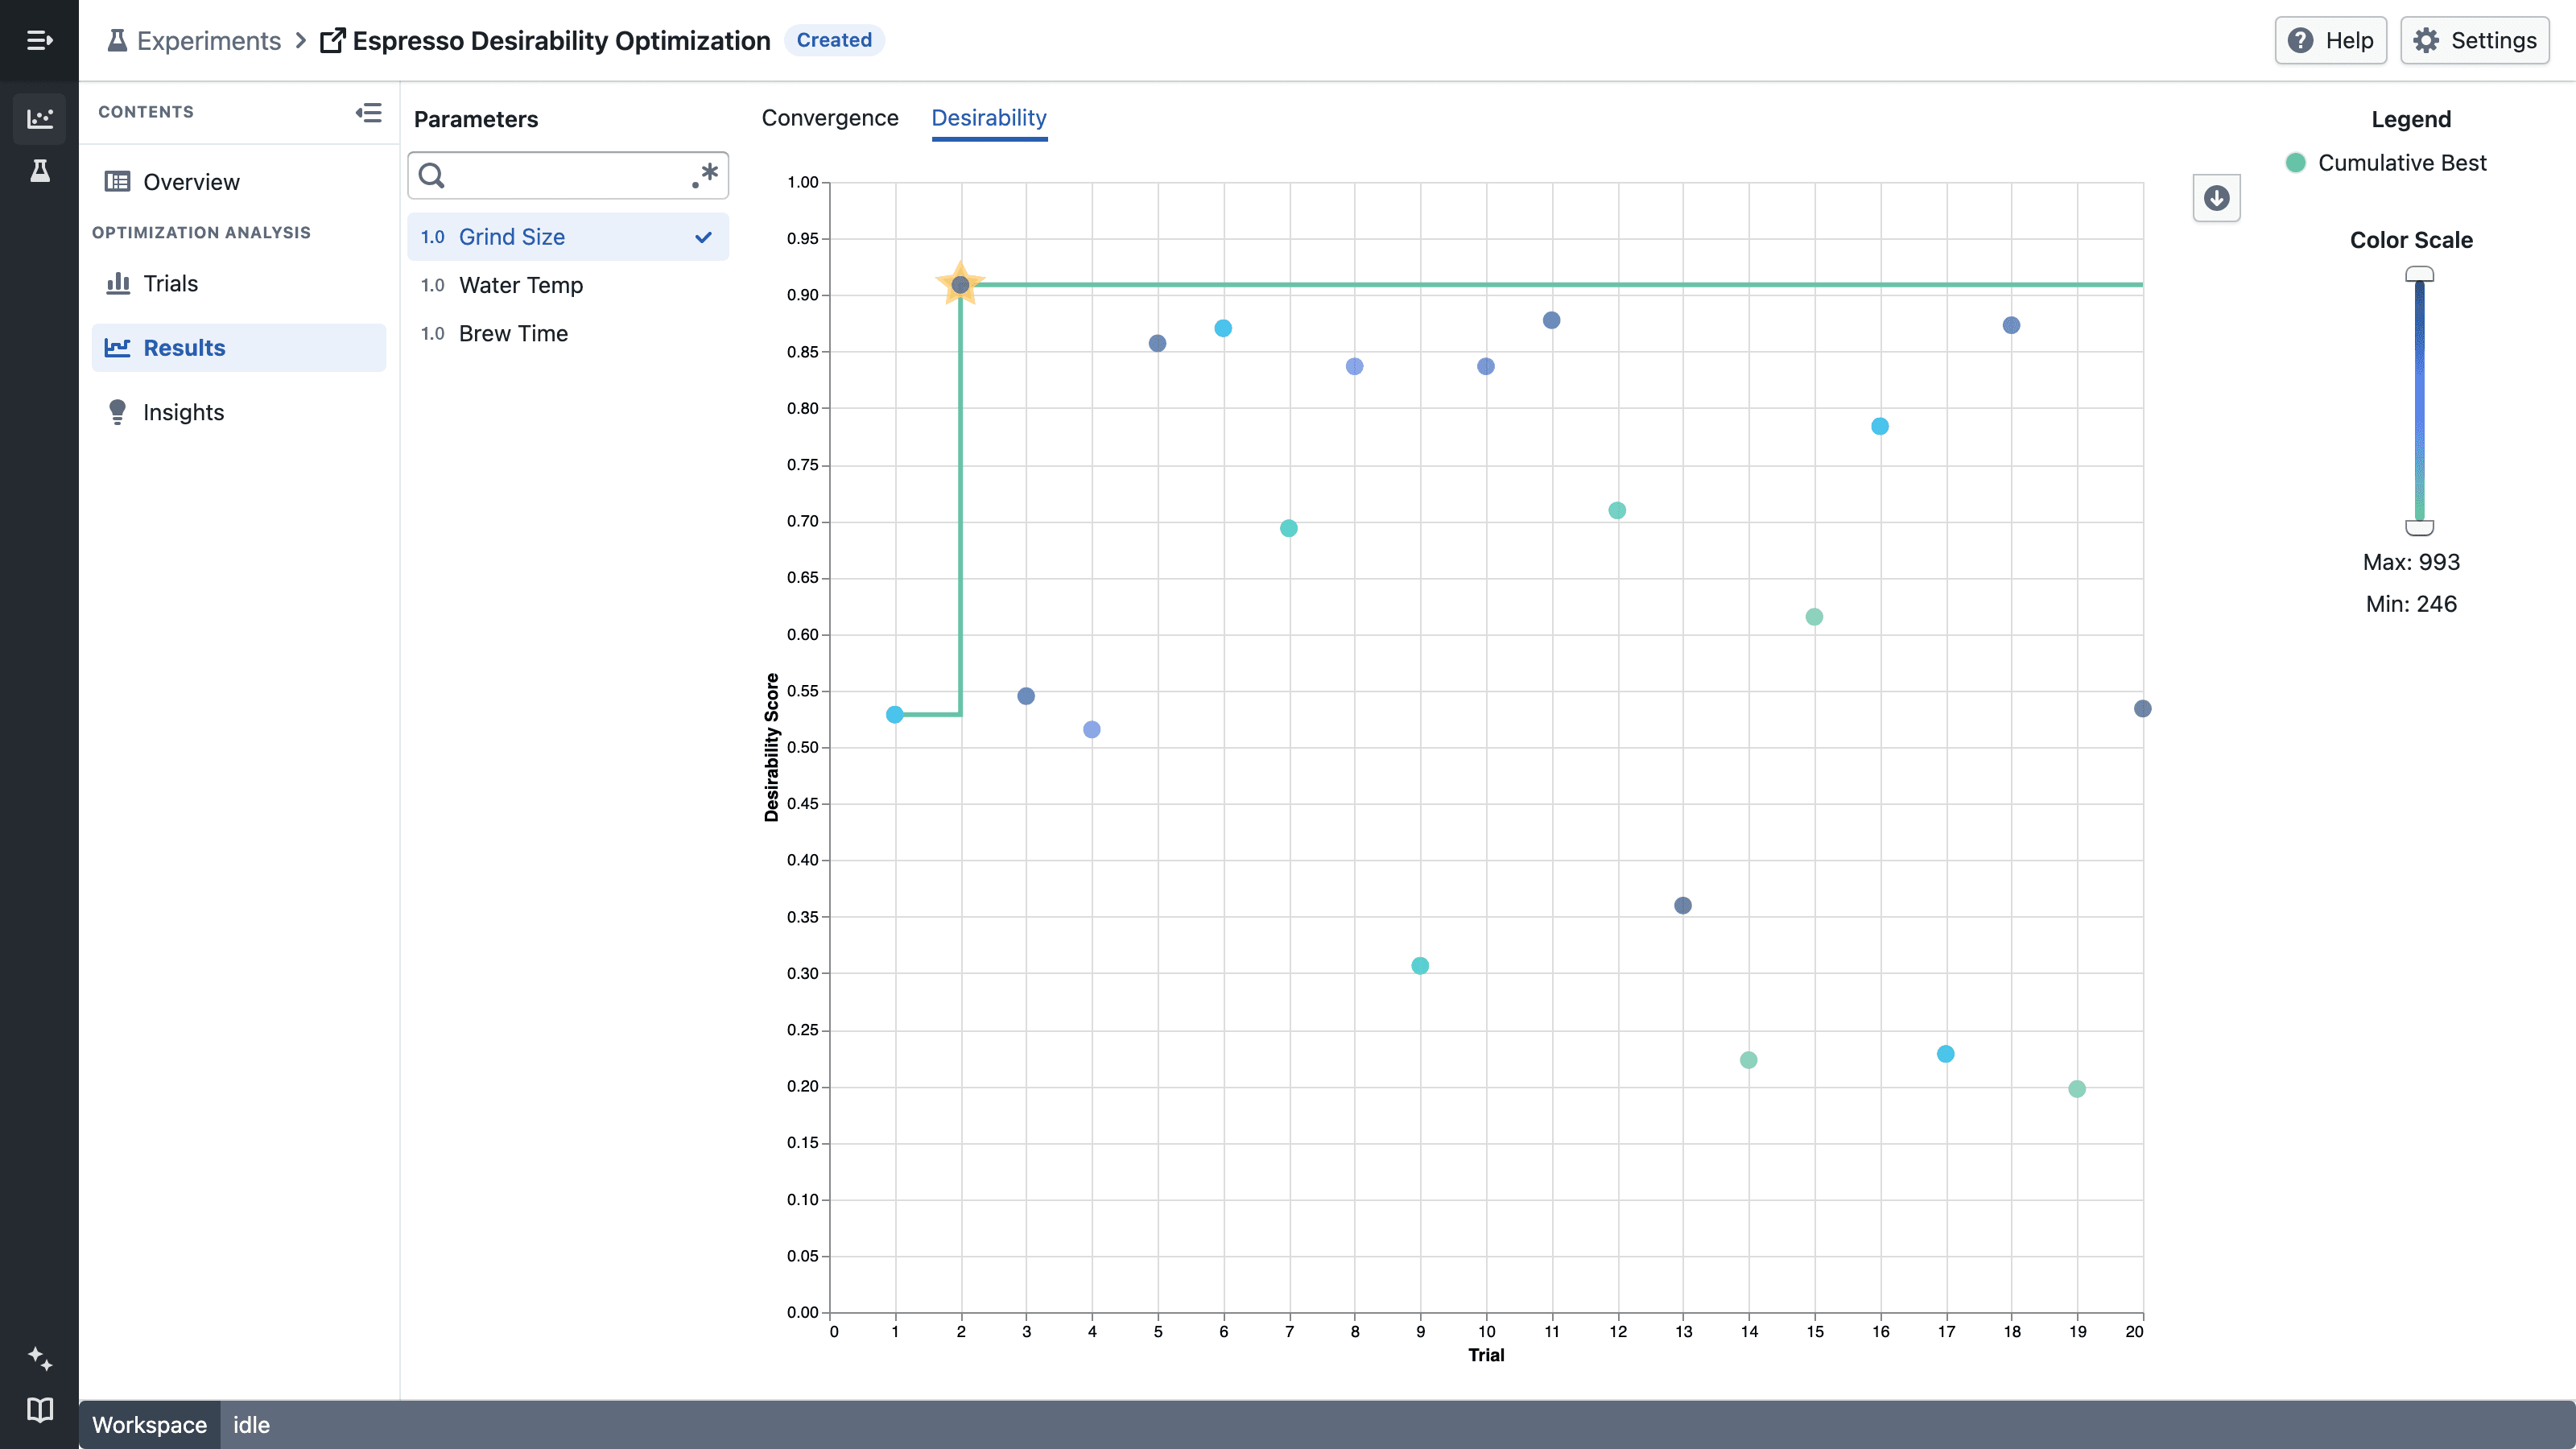
Use Desirability when multiple targets are combined into one overall objective. This is useful when you want one score that reflects how well a trial balances all targets together.
Pareto front
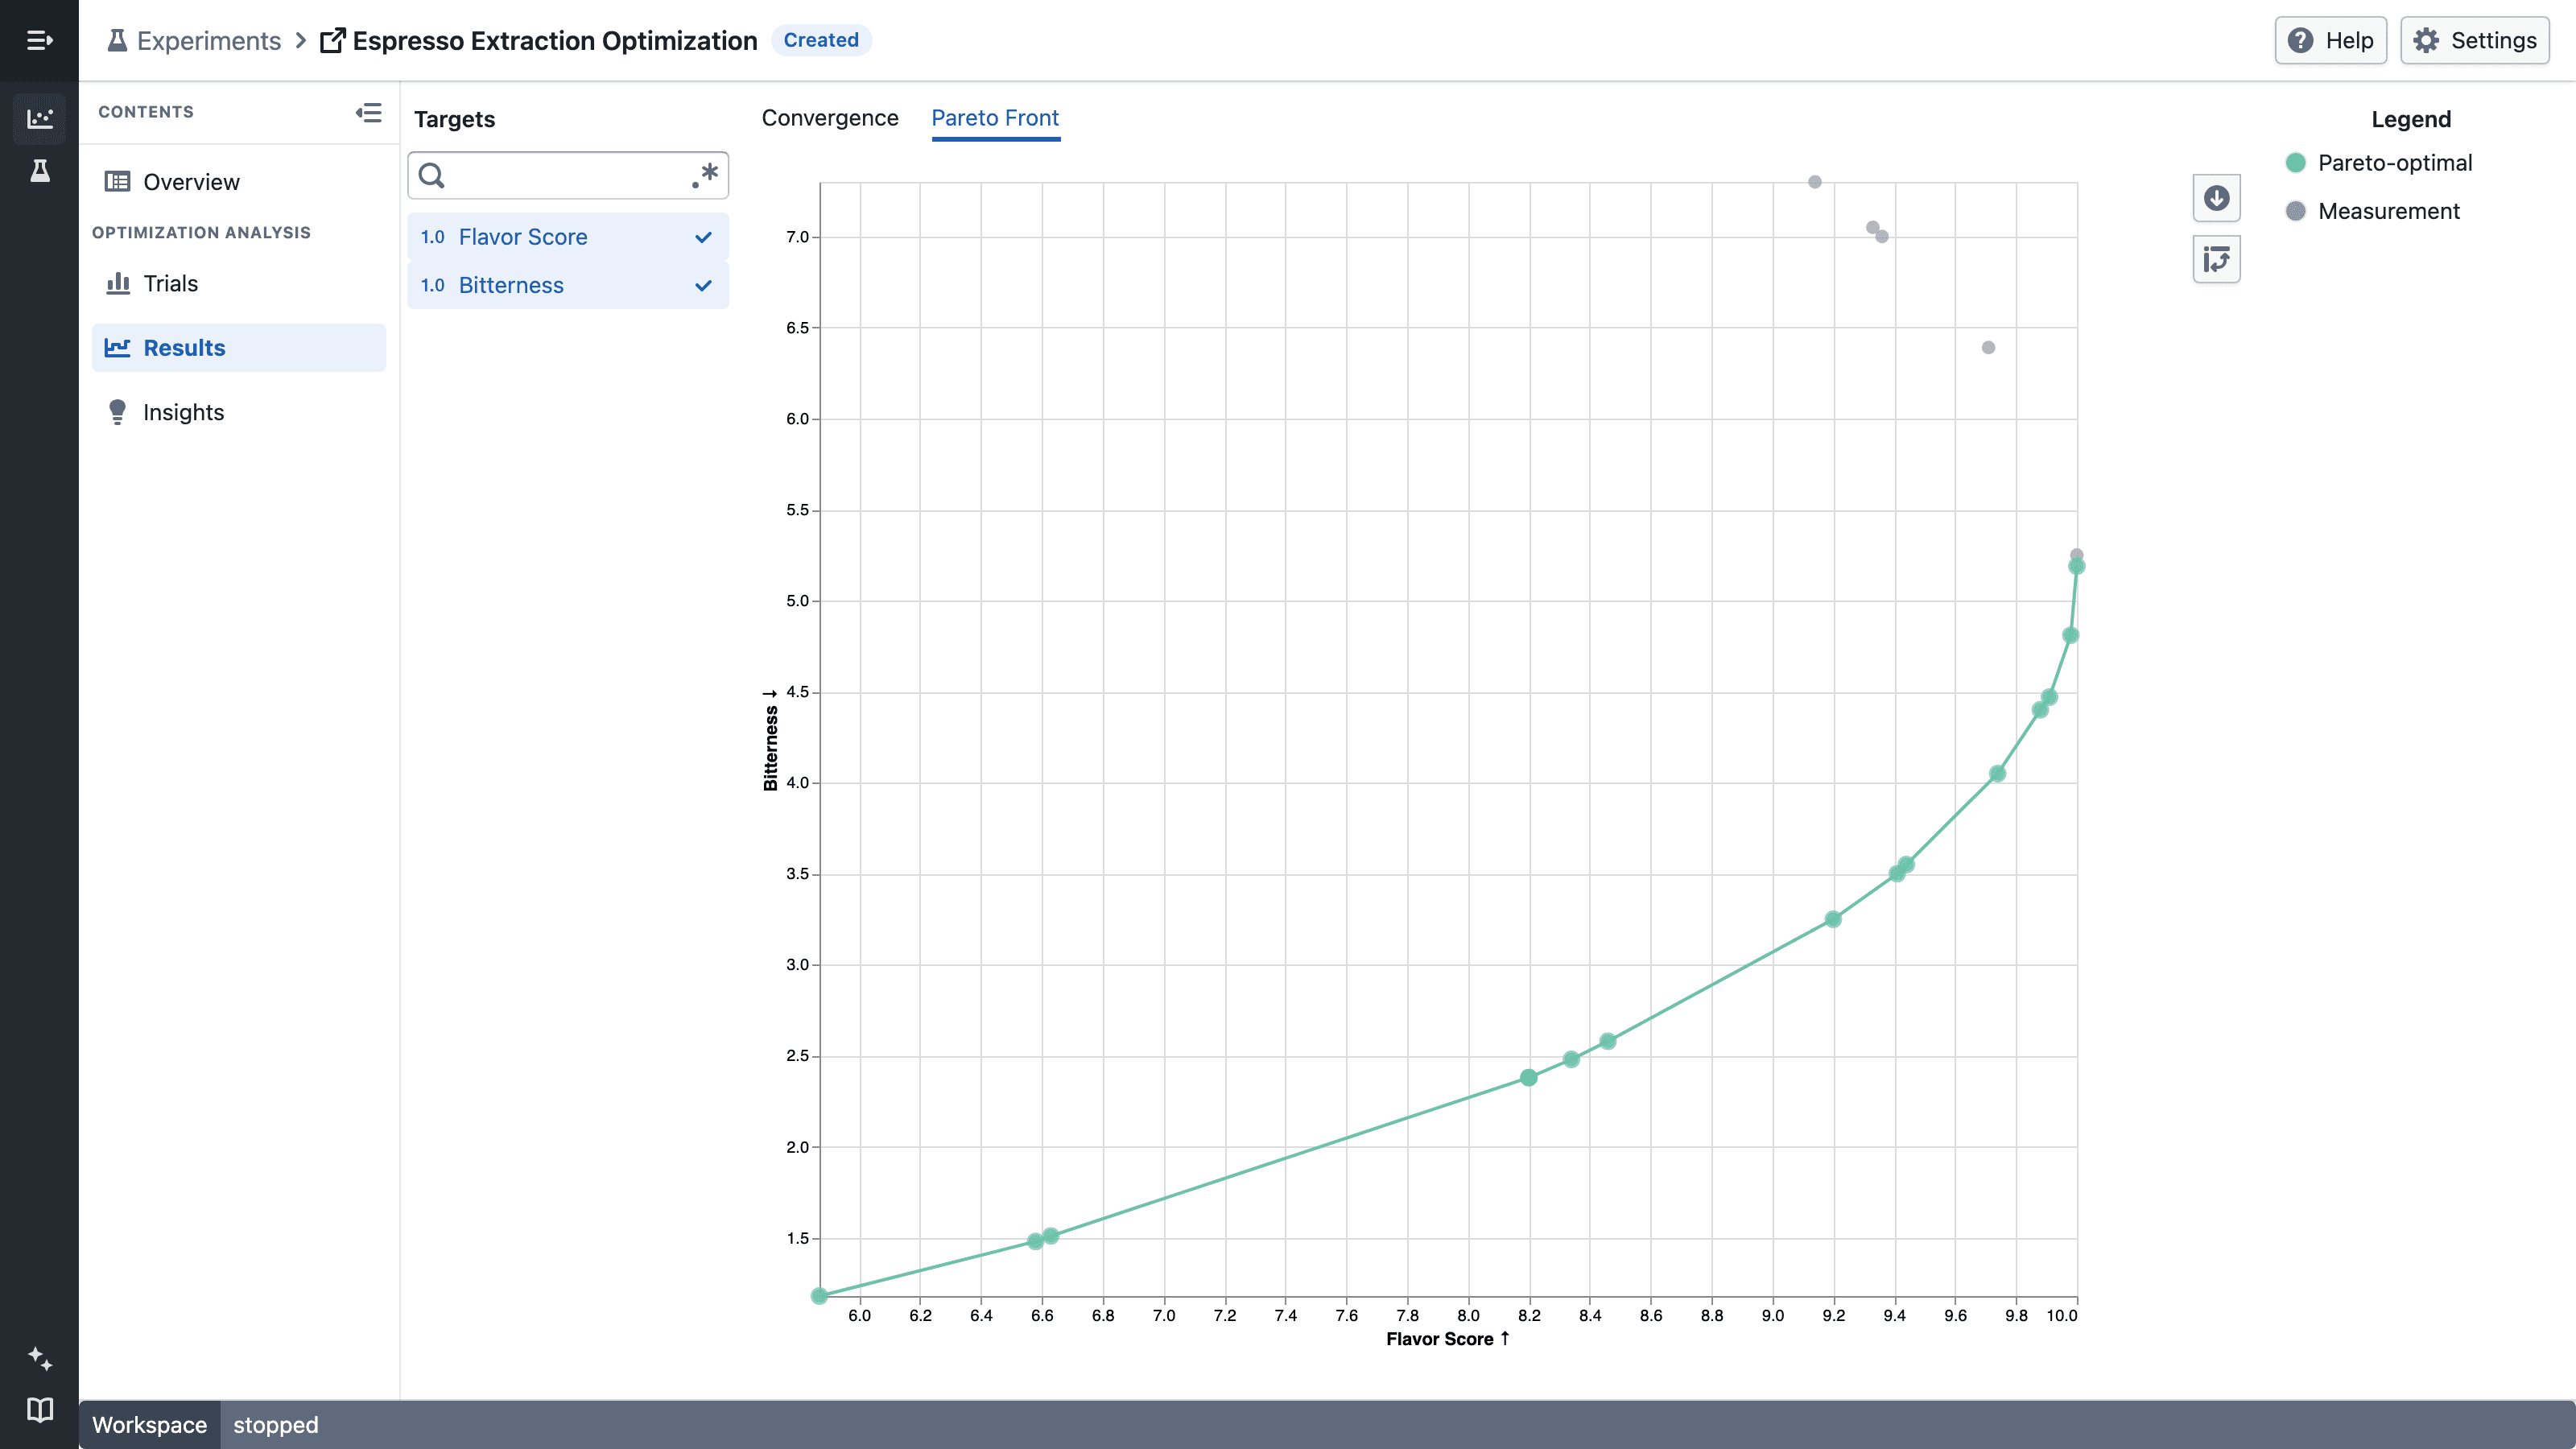
Use Pareto front when you want to compare trade-offs directly instead of collapsing them into one score. This is useful when improving one target tends to worsen another and you want to review the alternatives before deciding.
Each point represents a completed trial for the two selected targets. Pareto-optimal points form the highlighted front; the remaining measurements are dominated because another trial performs at least as well without worsening the other target. Use the target list to choose the two axes, and use the toolbar to swap them.
Notes
- Results becomes more useful as more trials are completed.
- If no completed trials are available yet, the charts may be empty or have very limited information.
- Convergence is always listed. Desirability appears only for a desirability objective, while Pareto front appears only for experiments with multiple targets that do not use a desirability objective.
- Looking for parameter importance or parallel coordinates? Those live on the Insights page, which focuses on why trials turned out the way they did rather than what happened.