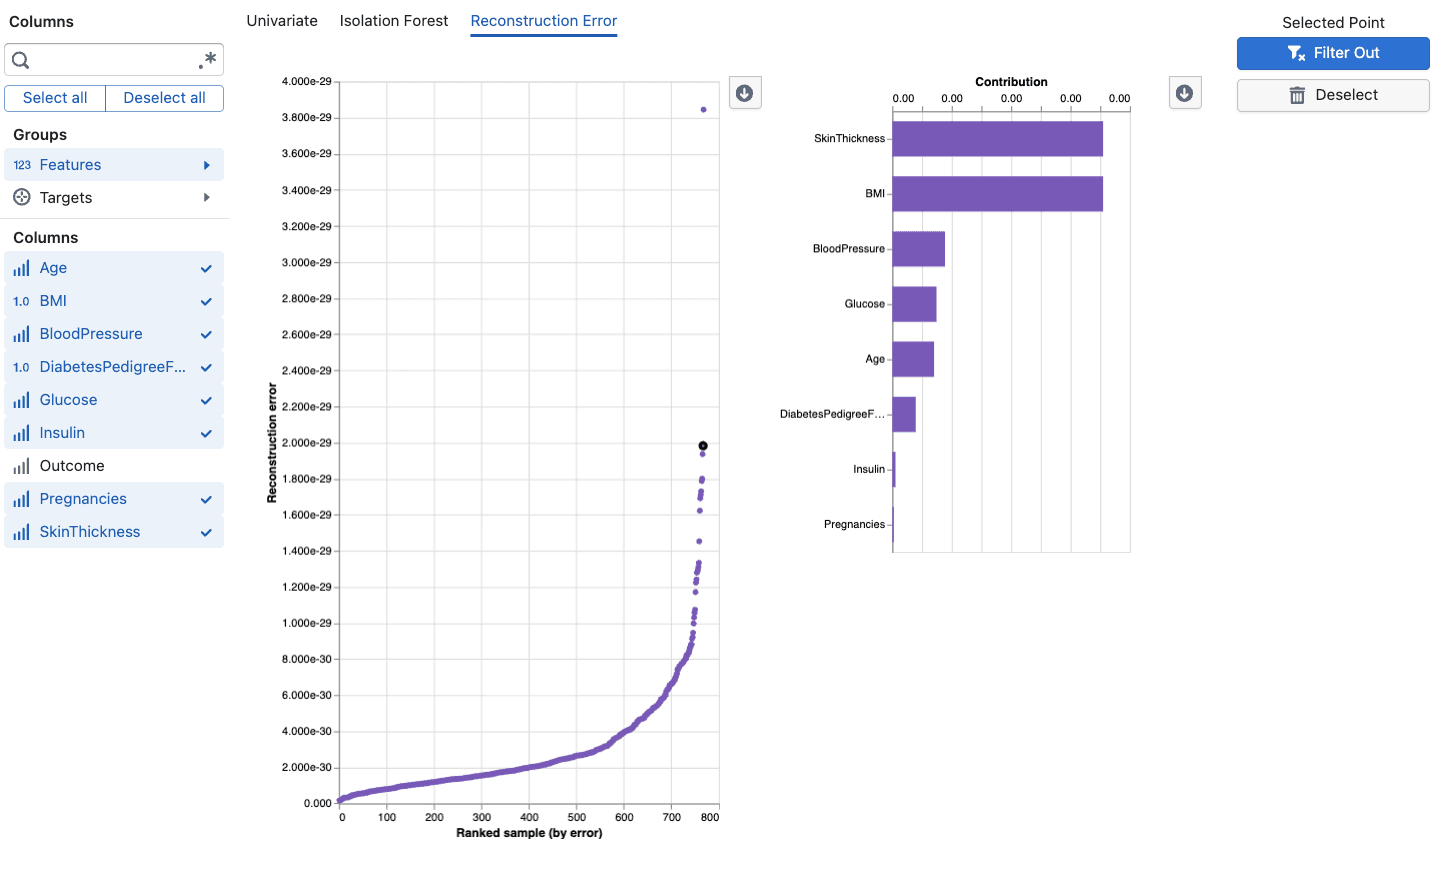
Reconstruction Error
Access Athinia Catalyst at catalyst.athinia.io.
The Reconstruction Error tool detects multivariate outliers using Principal Component Analysis (PCA). It learns the dominant patterns in your data by compressing it into a lower-dimensional representation and then reconstructing it back to the original space. Data points that follow typical patterns are reconstructed accurately with low error, while anomalous points produce high reconstruction errors because they do not fit the variance structure captured by the principal components. This approach is effective at detecting multivariate anomalies because PCA captures the correlations between all selected features simultaneously. A data point that deviates from the learned correlation structure, even if each individual value looks normal, will have a high reconstruction error. In practice, this makes Reconstruction Error well suited for identifying observations that violate the expected relationships between process parameters, such as a combination of temperature, pressure, and flow rate that does not match the patterns seen in the rest of the dataset.
Key Features
PCA-Based Reconstruction
The tool fits a PCA model to your data and uses it for anomaly detection:
- Compresses data into principal components that capture the dominant variance and correlations
- Reconstruction error serves as the anomaly score, where higher error means more anomalous
- Points that deviate from the learned correlation structure produce high errors
- No manual tuning required since the number of components adapts to your data
Column Selection
Select the numerical columns to include in the analysis:
- At least three numerical columns are required
- Choose variables that represent related aspects of your process
- The tool automatically filters to numerical data types (Float64, Int64)
- More relevant features improve the model's ability to detect meaningful anomalies
Contribution Analysis
When you select a data point, the tool shows a feature contribution breakdown:
- Residuals: Shows how much each feature's reconstructed value differs from the original
- Top contributors: Features with the largest residuals are the main drivers of the anomaly
- Original vs. Reconstructed: Compare what the model expected versus what was observed
- Helps you identify which specific process parameters are behaving unusually
Anomaly Score Visualization
The main chart displays reconstruction error for each data point:
- Points are plotted by their reconstruction error (y-axis) against their rank by error (x-axis)
- Higher points have larger reconstruction errors and are more likely anomalous
- Click on any point to see its detailed contribution analysis
Using the Tool
Basic Workflow
- Select Columns: Choose at least 3 numerical features relevant to your analysis
- Review the Chart: Examine the reconstruction error scatter plot where points with high error are potential outliers
- Investigate Points: Click on high-error points to see which features contribute most to the anomaly
- Validate Findings: Use the contribution analysis to confirm whether the flagged point represents a genuine process deviation
- Compare Methods: Cross-reference with Isolation Forest and Univariate methods for comprehensive analysis
Interpretation Guidelines
Reconstruction Error Plot:
- Points with notably higher error than the majority indicate anomalies
- A clear gap between normal points and high-error points suggests well-defined outliers
- Gradually increasing errors without a clear threshold may indicate a continuum rather than distinct outliers
Feature Contributions:
- Features with large residuals are the primary drivers of the anomaly
- If a single feature dominates, the anomaly may be effectively univariate
- Multiple contributing features suggest a complex multivariate deviation
- Compare original and reconstructed values to understand the direction of deviation
Anomaly Scores:
- Scores represent the total reconstruction error across all features
- There is no fixed threshold, so interpret scores relative to the distribution in your dataset
- Consistently high scores for a subset of points suggest systematic issues
Best Practices
- Include at least 3-5 related features for PCA to learn meaningful correlation patterns
- Use domain-relevant variables because unrelated columns add noise without improving detection
- Compare with Isolation Forest since each method has different strengths for different types of anomalies
- Investigate top contributors before deciding whether a flagged point is truly anomalous
- Consider the data size because PCA works best with sufficient data to estimate stable correlations (50+ observations recommended)
Frequently Asked Questions
How is Reconstruction Error different from Isolation Forest?
Isolation Forest uses random partitioning to identify points that are easy to isolate. Reconstruction Error uses PCA to learn the correlation structure of your data and flags points that cannot be accurately reconstructed from the principal components. Reconstruction Error provides detailed per-feature contribution analysis that explains why a point was flagged, while Isolation Forest uses SHAP explanations. Both detect multivariate anomalies, but they approach the problem differently and may flag different points.
How many columns do I need?
A minimum of 3 numerical columns is required. The method works best with 5-20 related features that capture different aspects of your process. Too few features limit the model's ability to learn complex patterns.
Why does my point have a high reconstruction error?
A high reconstruction error means PCA could not accurately reconstruct that data point from its principal component representation. This happens when the point's combination of feature values does not match the correlation patterns learned from the rest of the data. Check the contribution analysis to see which specific features are causing the high error.
What does the contribution chart show?
The contribution chart breaks down the reconstruction error by feature. For a selected point, it shows which features have the largest difference between their original value and the value the model predicted (reconstructed). Large residuals indicate the features where the point deviates most from expected patterns.
Can I use this with small datasets?
PCA needs sufficient data to estimate stable correlations. With very small datasets (fewer than 50 observations), the model may not learn robust patterns and results should be interpreted cautiously. For small datasets, consider using Isolation Forest or Univariate methods instead.
How does this handle missing values?
The tool handles missing values automatically through standard imputation. However, columns with very high rates of missing data may reduce detection accuracy. Consider excluding columns with more than 30% missing values.
Should I use all available columns?
No. Select columns that are relevant to the process aspect you're investigating. Including unrelated columns adds noise and can reduce the model's ability to detect meaningful anomalies. Focus on variables that are expected to have structured relationships.
How do I decide between the three outlier methods?
- Univariate: Use when you suspect individual variables have extreme values
- Isolation Forest: Use for general-purpose multivariate outlier detection, especially with smaller datasets
- Reconstruction Error: Use when you suspect violations of the linear correlation structure between variables or want to understand which features drive the anomaly