Principal Component Analysis
Access Athinia Catalyst at catalyst.athinia.io.
Overview
Principal Component Analysis (PCA) converts a set of correlated numeric variables into a smaller ordered set of orthogonal (uncorrelated) latent variables called principal components (PCs). PC1 captures the largest share of total variance, PC2 the next largest, and so on. Each observation (lot, wafer, pass, die) is projected into this space to obtain PC scores. This makes high‑dimensional structure visible, suppresses noise, reduces redundancy, and provides a stable basis for clustering and drift or excursion detection.
Typical Semiconductor Uses
Inline metrology (critical dimension, overlay, thickness), chamber sensors (pressure, temperature, RF power), electrical parametrics (resistance chains, threshold voltage families), wafer map texture embeddings, and material characterization panels often contain dozens to hundreds of mutually correlated variables. PCA compresses them into a handful of composite signals so that:
- Excursions emerge earlier as a shift in one PC.
- Tool or chamber matching compares score distributions instead of noisy raw channels.
- Yield drift root causes link feature loadings to lithography, CMP, plating, or etch phenomena.
- Defect pattern or spatial texture descriptors cluster more cleanly after reduction.
- Material supplier or lot variability is monitored with a compact PC dashboard. Example: 500 metrology + parametric variables may reduce to ~8 components explaining >90% cumulative variance and separating normal vs. edge-drift vs. focus-misalignment populations.
Core Concepts
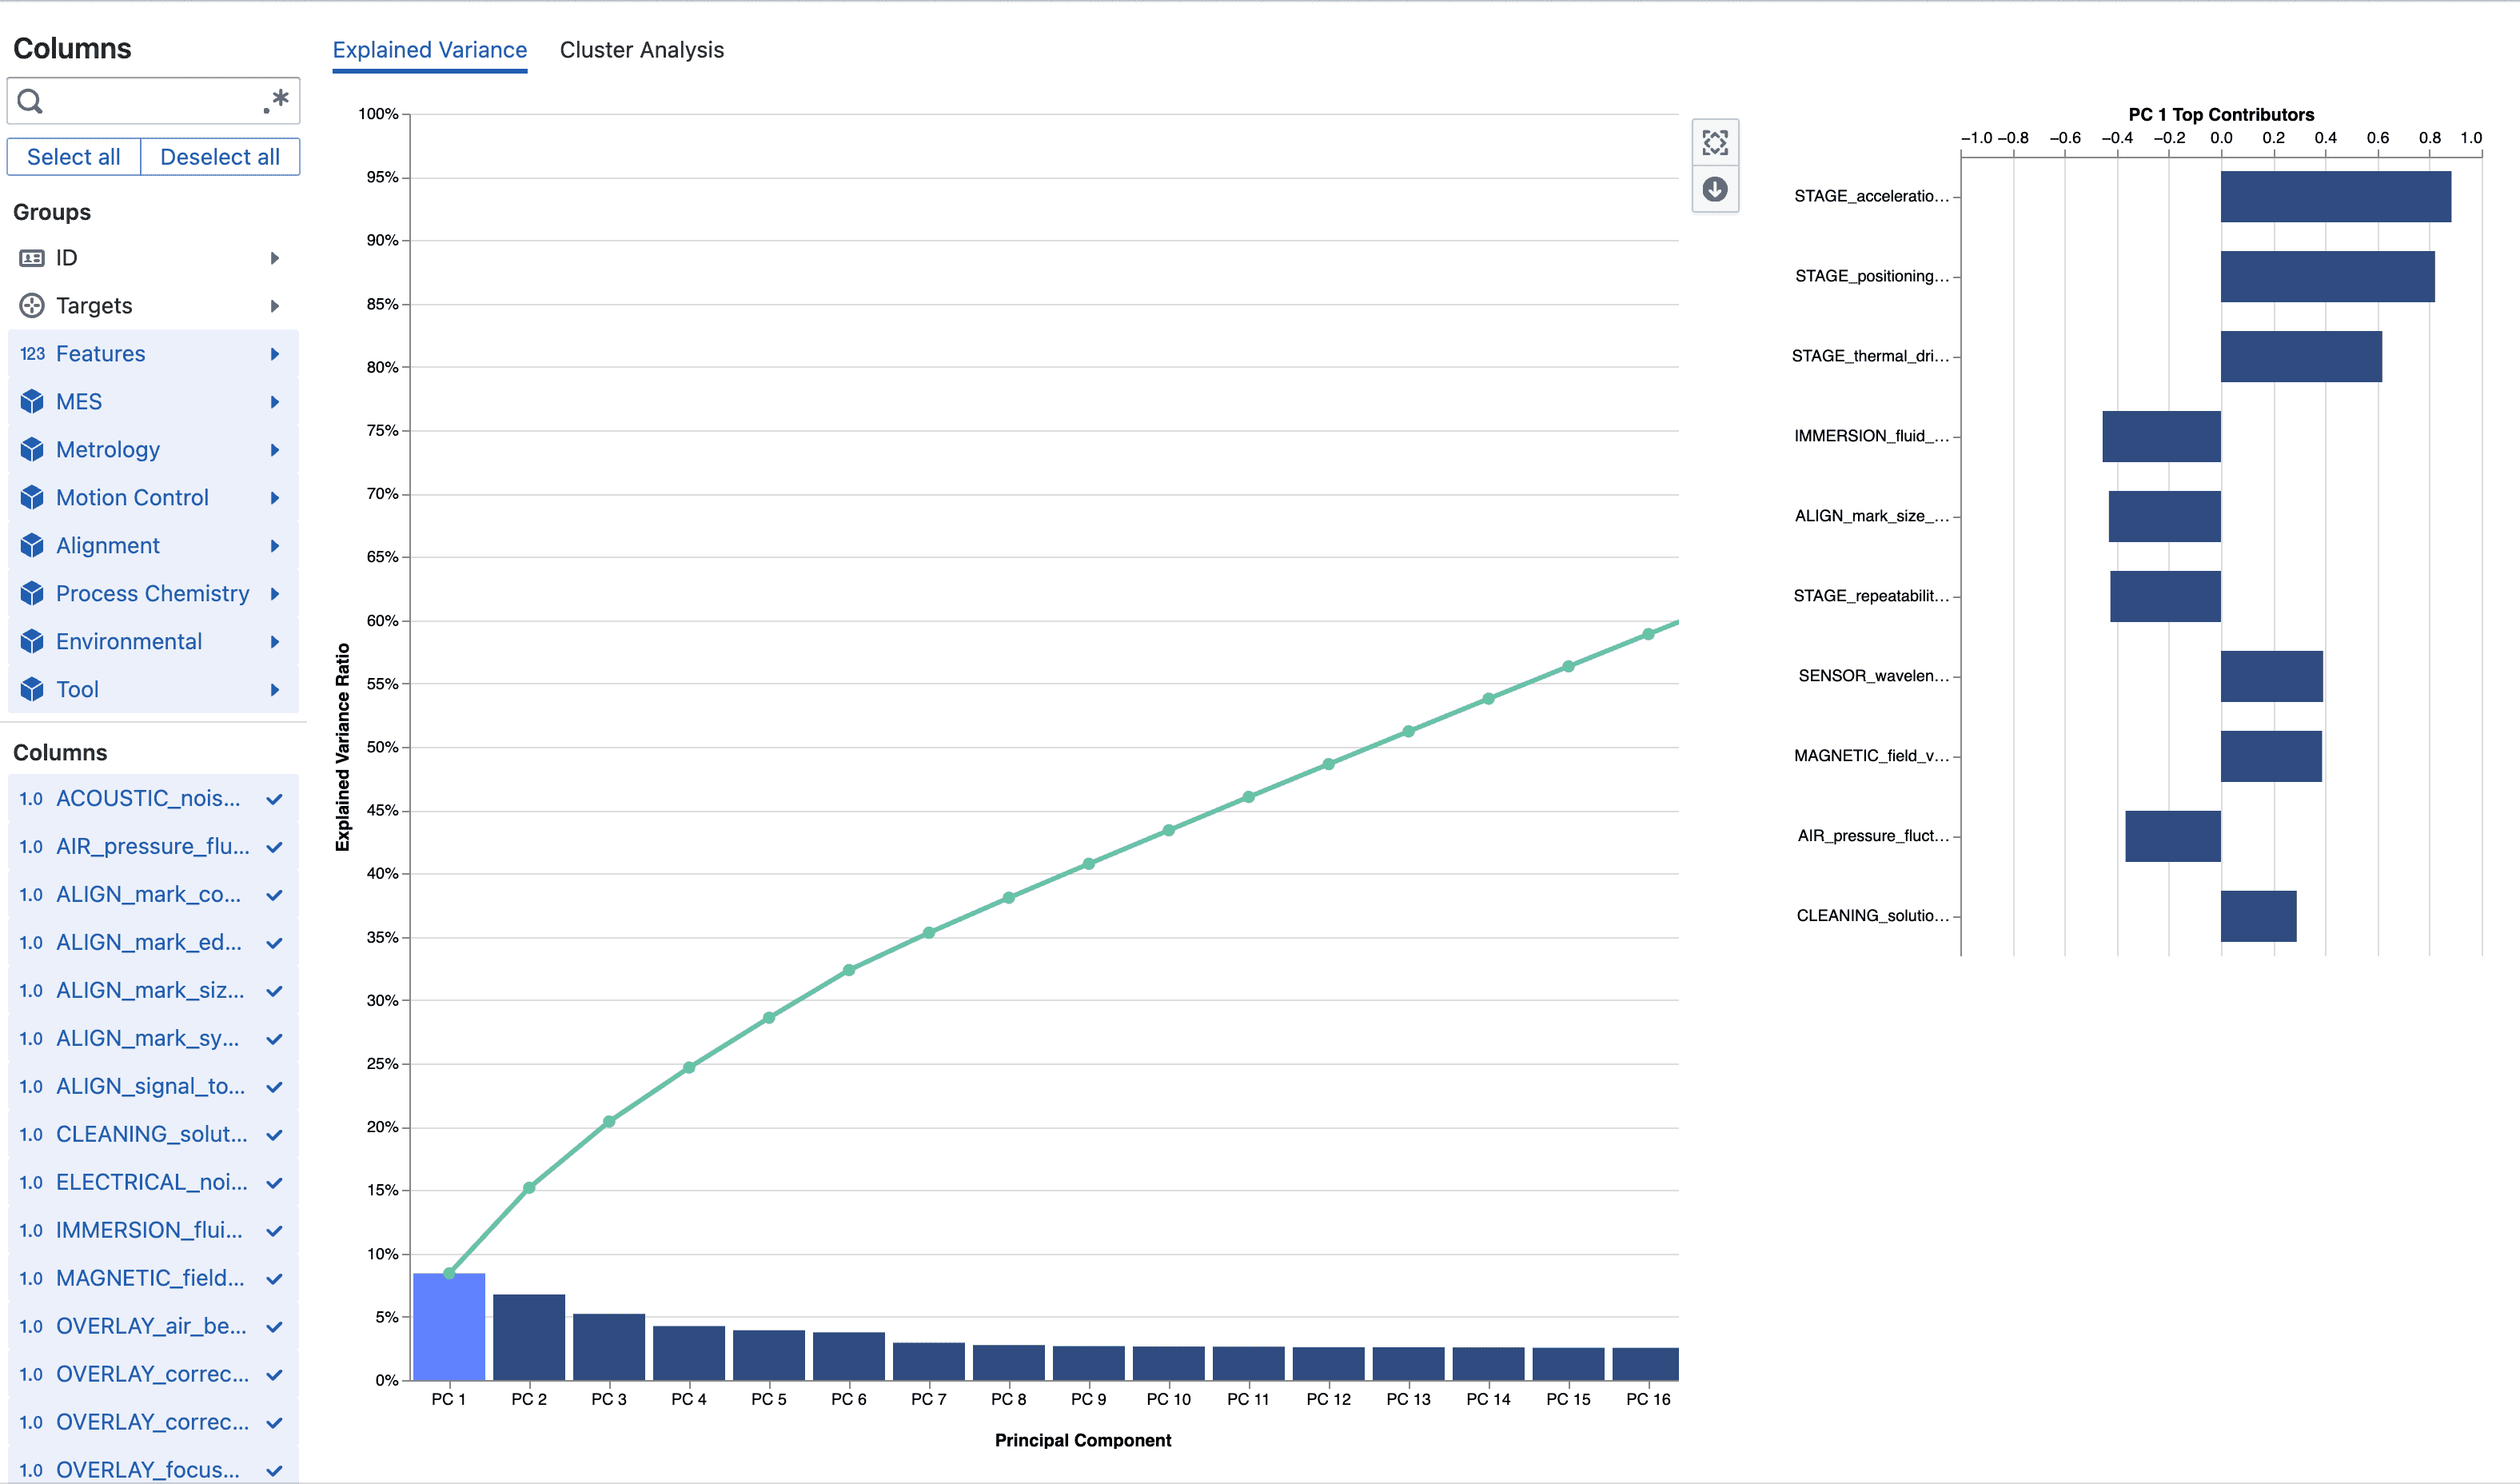
- Explained variance ratio: Fraction of total variance a PC accounts for.
- Cumulative explained variance: Running total used to decide how many PCs are “enough” (often 90–95%).
- Loadings (feature contributions): Signed weights mapping original features to a PC; magnitude = influence; sign = direction relative to other features.
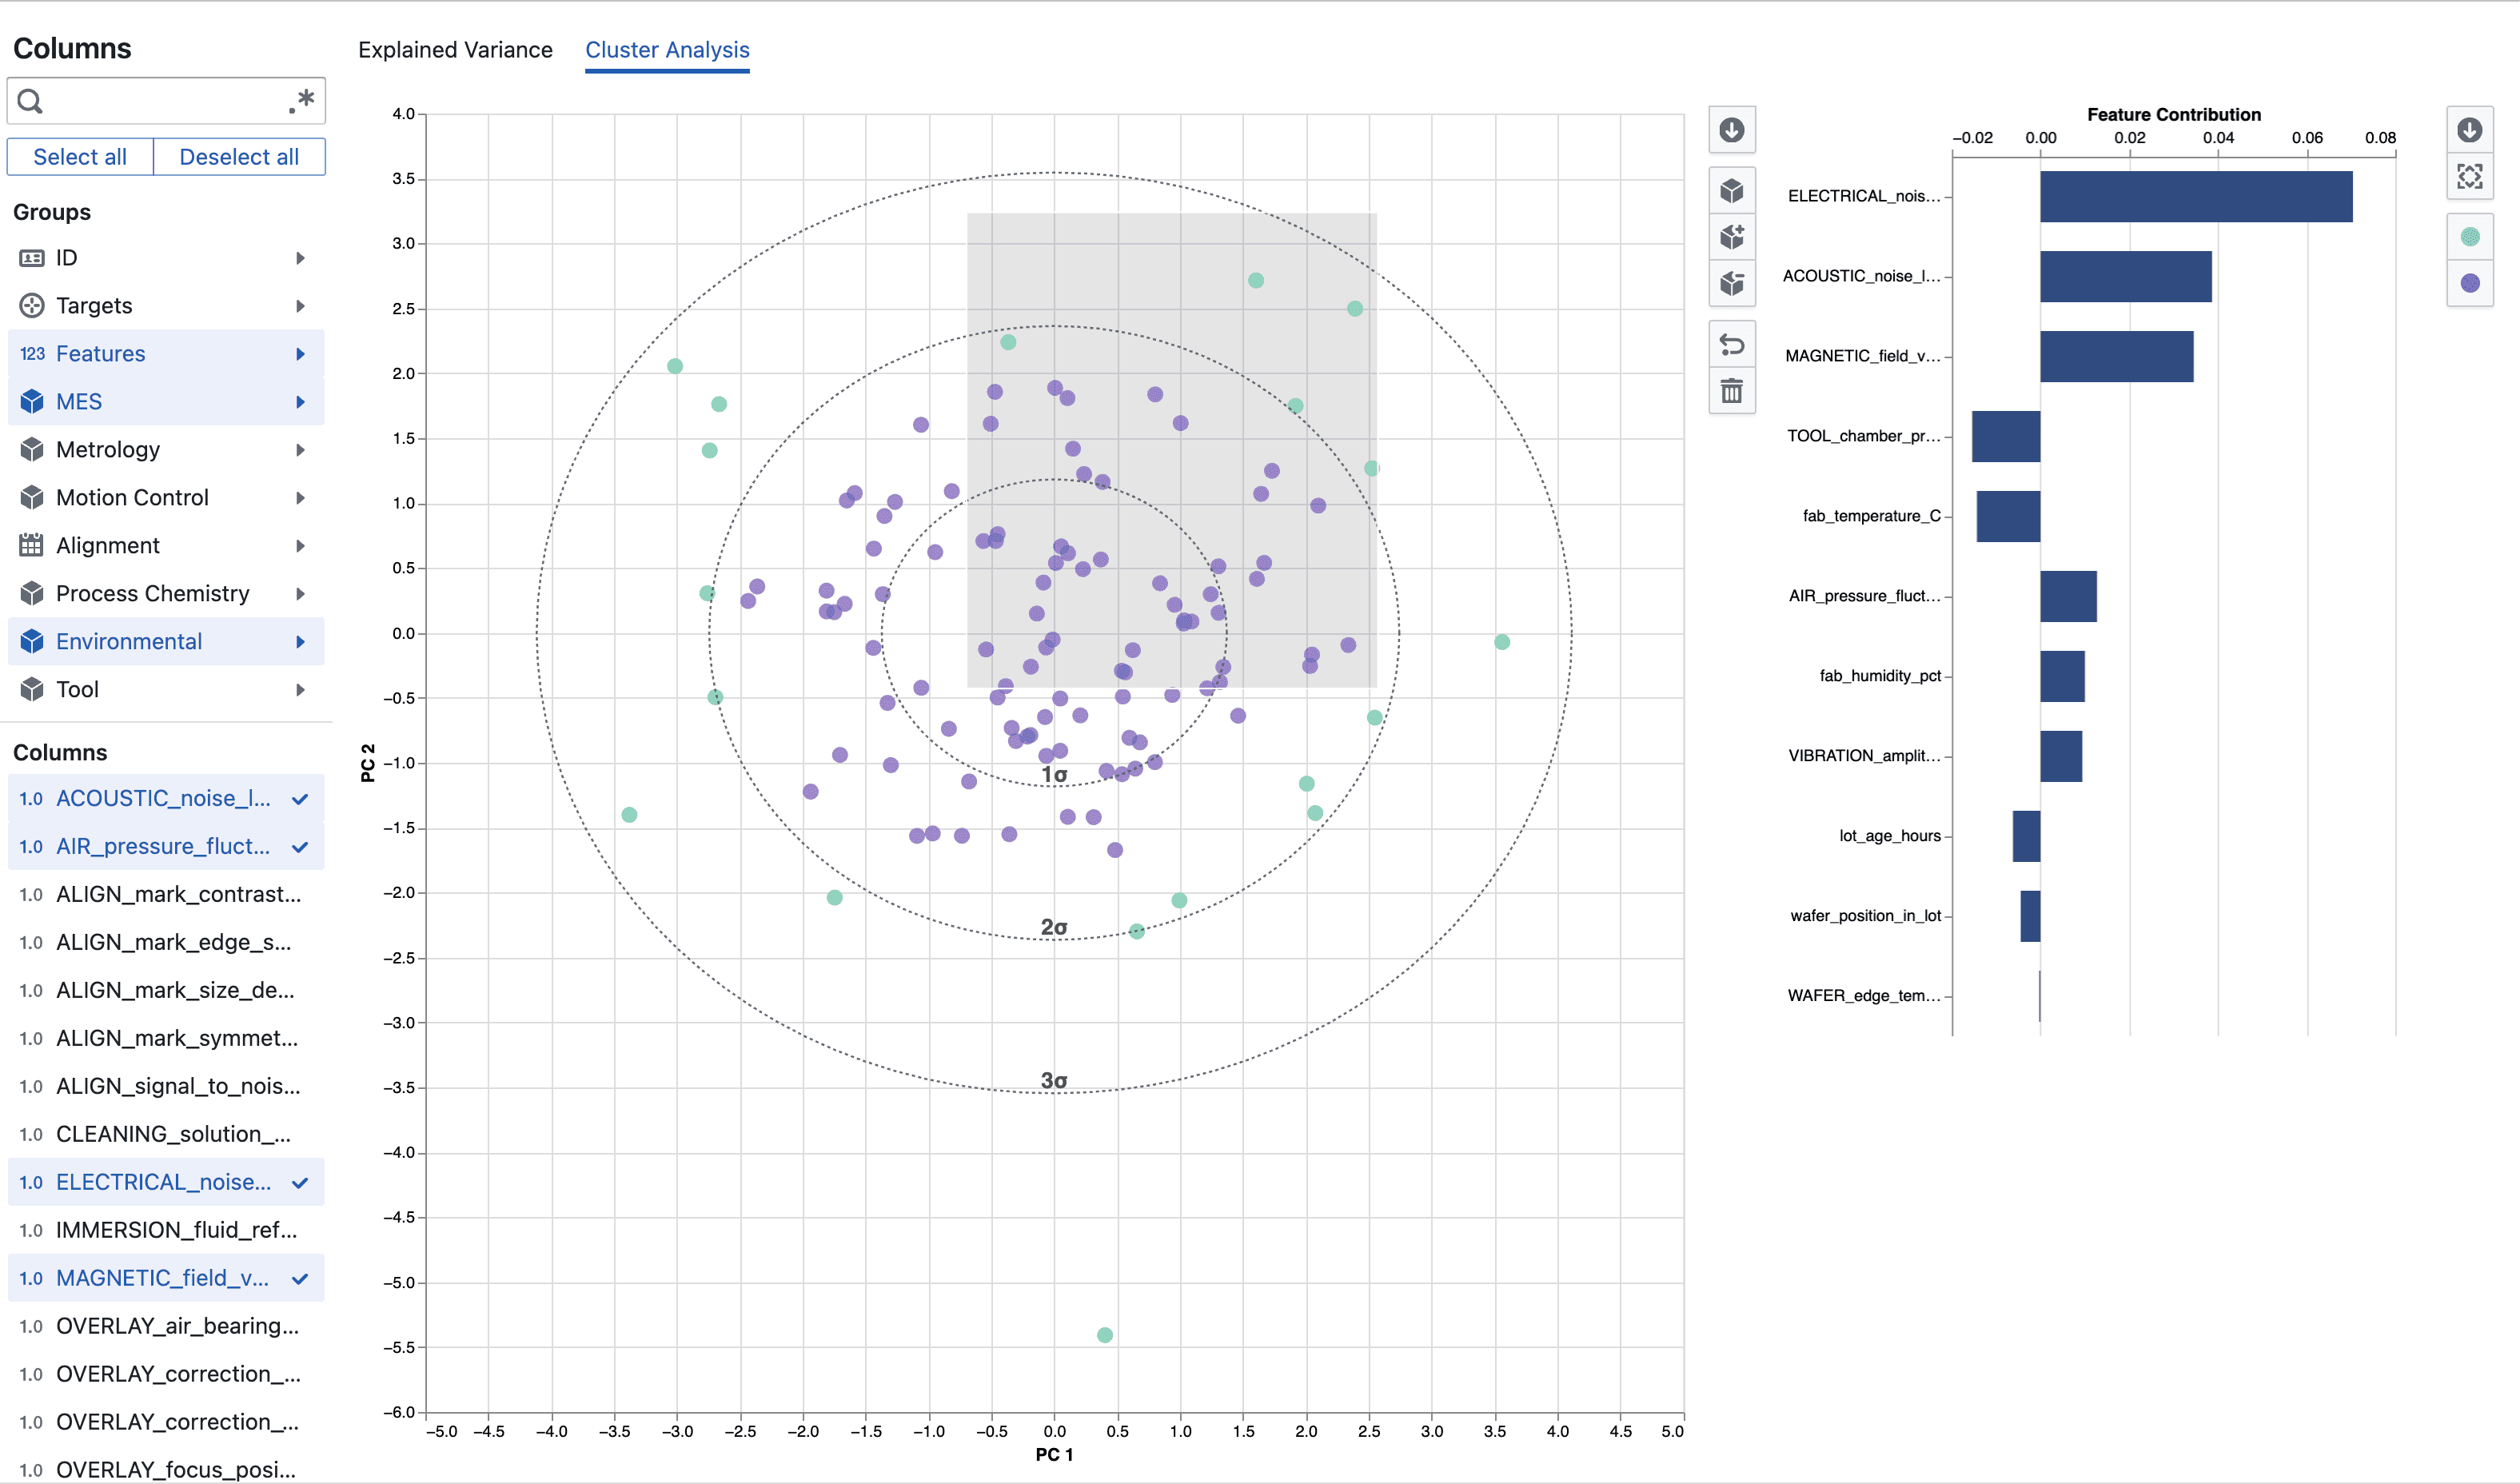
- Scores: Coordinates of each observation in PC space (used for visualization and clustering).
- Cluster difference contribution: Adjusted score indicating how strongly a feature differentiates two user-defined clusters.
Interface Structure
The PCA module consists of a left sidebar (column selection), a tab bar (Explained Variance, Cluster Analysis), and a main workspace. You must select at least two numeric columns for computation. On first load the system auto-selects numerical columns that belong to feature groups to reduce setup time. Changing the selection triggers recomputation of variance ratios, loadings, and scores.