PCA Cluster Analysis
Access Athinia Catalyst at catalyst.athinia.io.
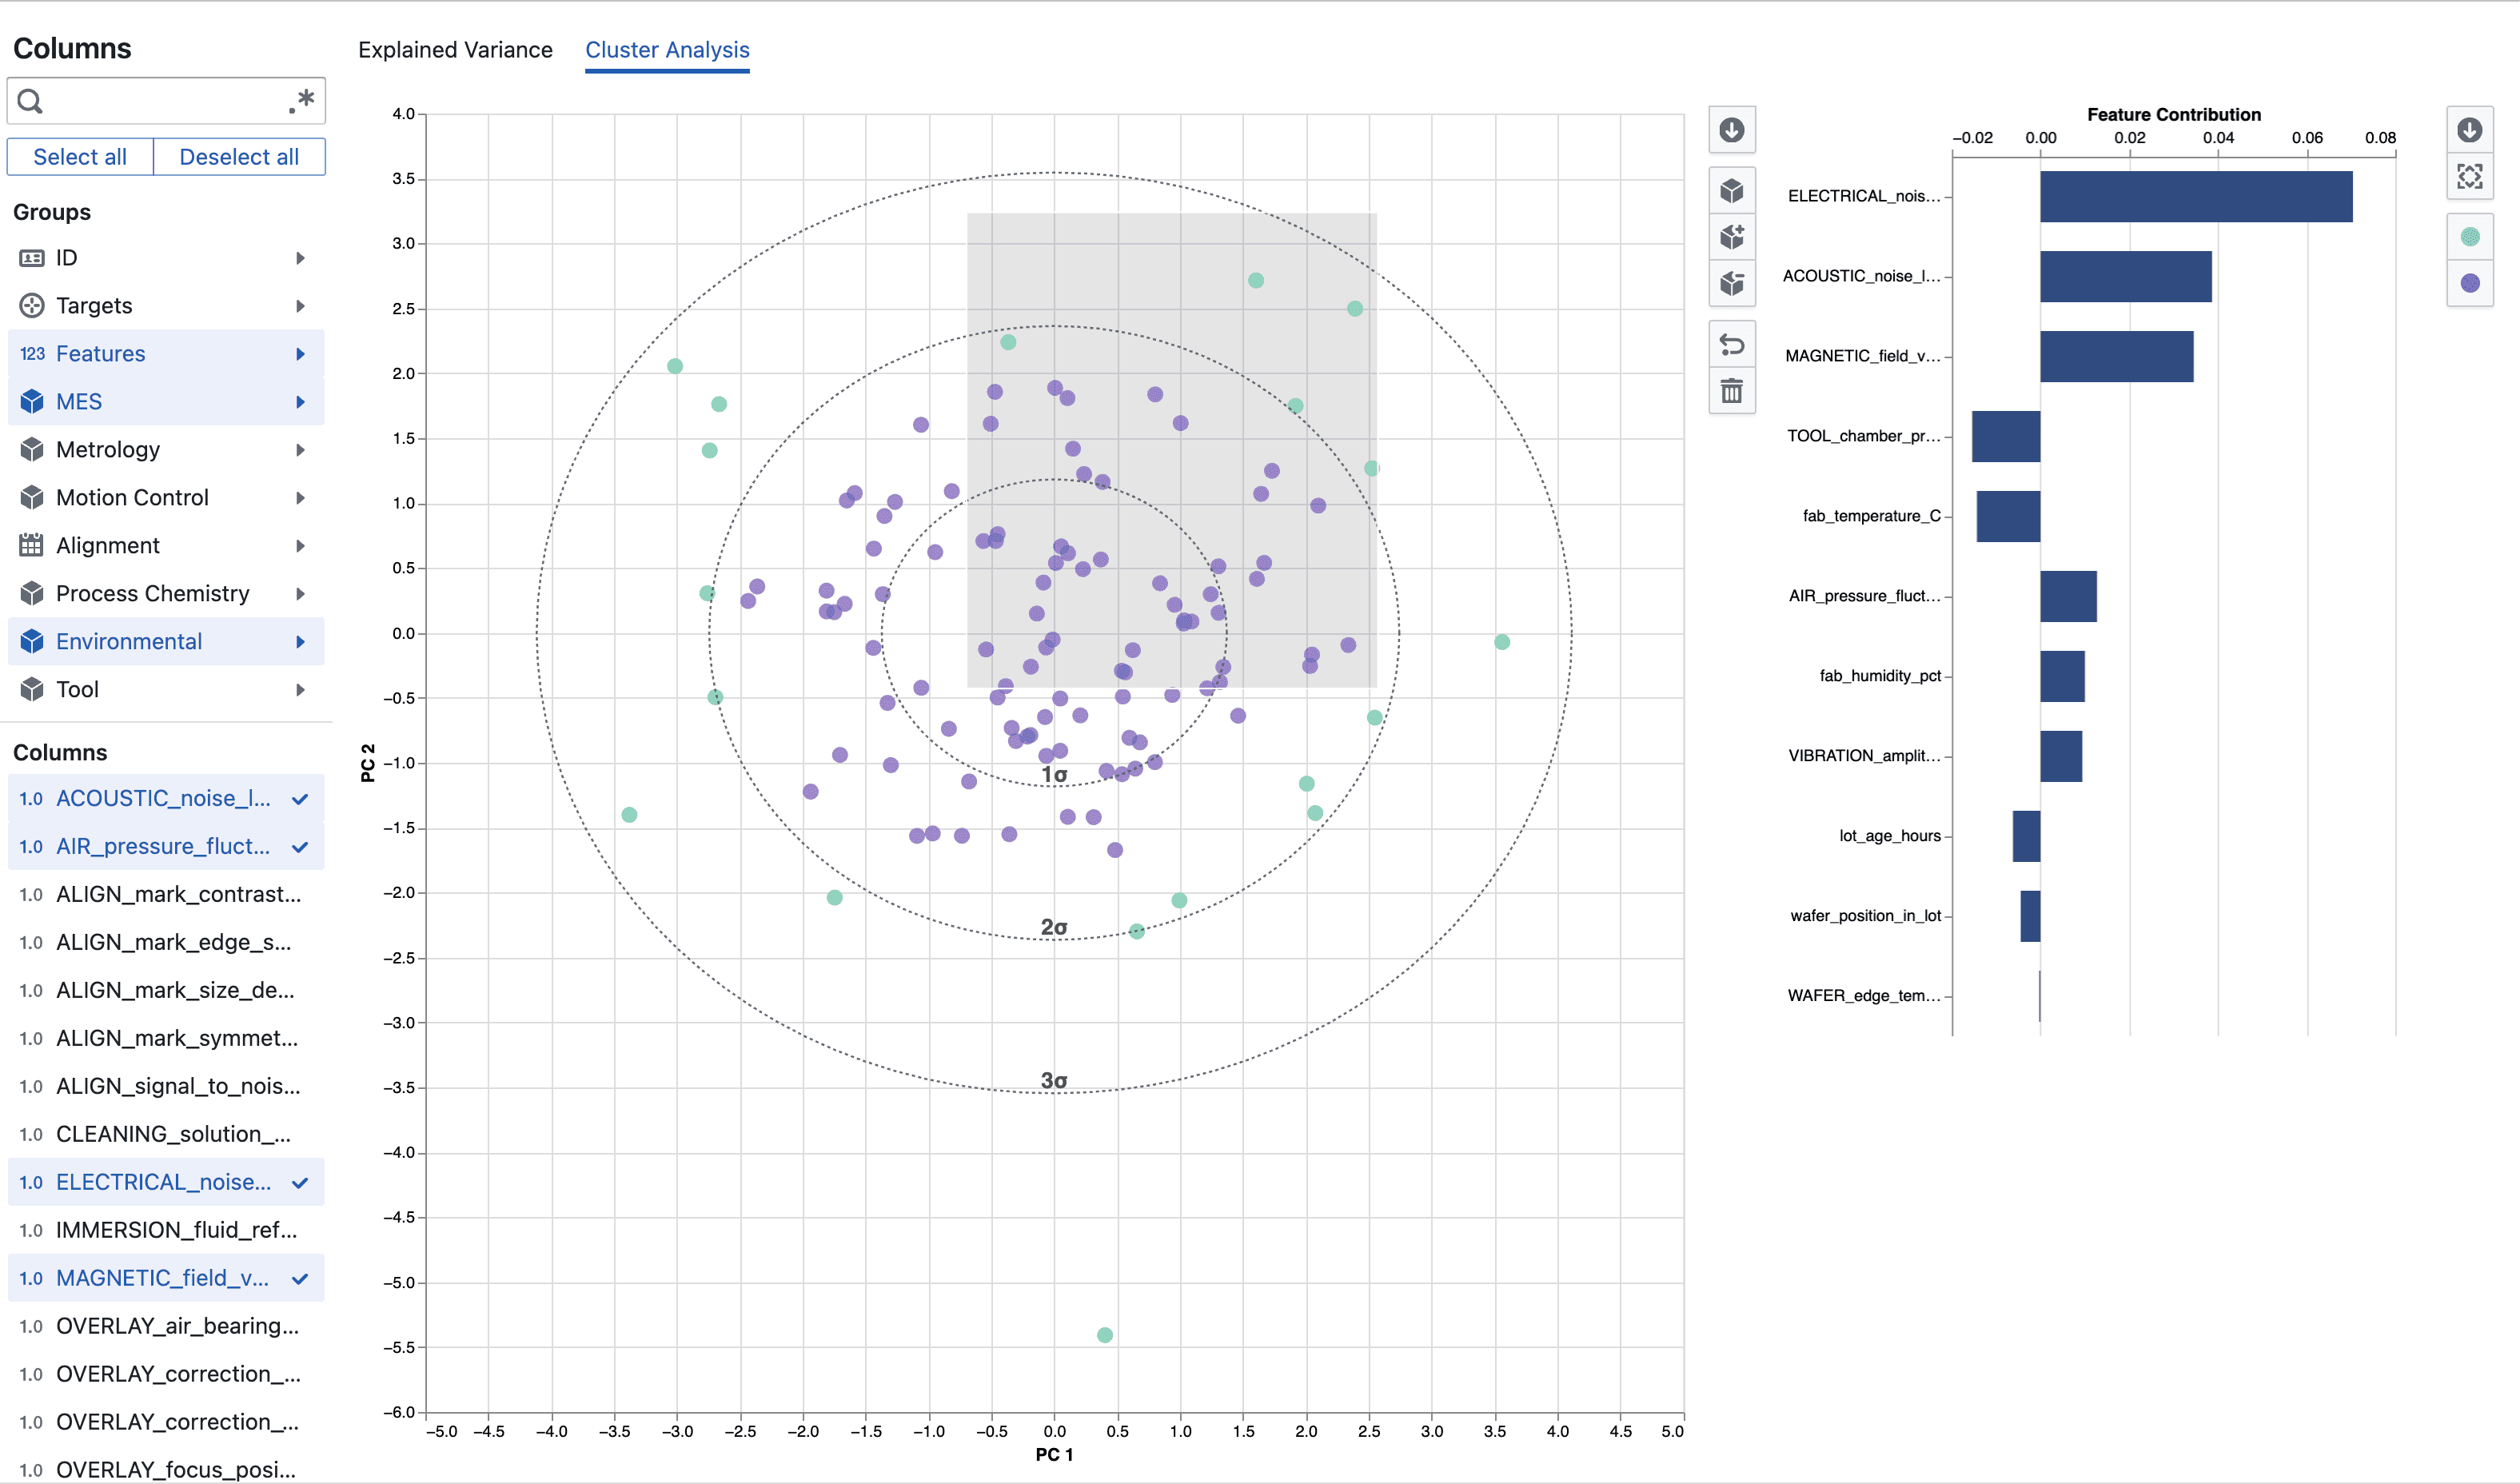
The Cluster Analysis tab lets you interactively segment observations in the two‑dimensional PCA score space (PC1 vs. PC2) and understand which original features differentiate user‑defined groups. Each point represents an observation (lot, wafer, pass, die, or measurement instance) projected onto the first two principal components. Concentric dashed rings (1σ, 2σ, 3σ) give an immediate sense of spread and potential outliers.
Interface Overview
When you open the tab, all points are initially “Unassigned” (grey). A vertical sidebar (shared with the Explained Variance tab) controls which numerical features feed the PCA; changing the feature set recomputes scores. The central canvas is an interactive scatter plot supporting rectangular brushing. To the right appears the Feature Contribution Difference panel once a cluster has been created. A slim tool strip beside the plot provides quick actions (e.g., download). Colors are automatically assigned and persisted locally.
Creating and Growing Clusters
You define clusters by brushing rectangular regions. After drawing a brush, you can create a new cluster or add the region to an existing one. Each cluster is the union of one or more saved rectangles (“bounding boxes”) with time ordering; the most recently added boxes are evaluated first when assigning points. Overlapping ranges therefore let you refine boundaries by layering more specific selections. Undo removes the last added box (and deletes an empty non‑baseline cluster). All definitions are stored in local browser storage tied to the study, allowing quick iterative exploration without backend overhead.
Assigning and Reassigning Points
Assignment is deterministic: for every point the system scans bounding boxes from most recent to oldest; the first box containing the point determines its cluster. If no box contains it, the point remains “Unassigned.” This approach lets you progressively carve precise shapes using multiple rectangles while keeping interaction latency low. To retract a mistaken selection, use Undo or redefine a box; to start over entirely, clear local storage or (if provided) use a reset control.
Comparing Two Clusters
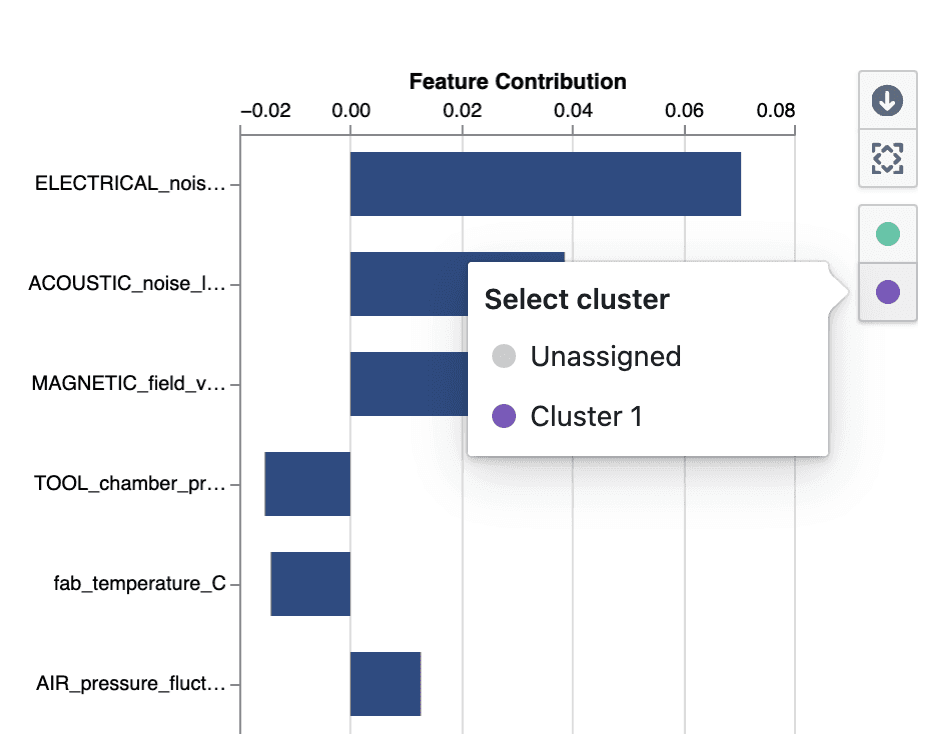
Once at least one cluster has been defined, the system selects a pair and issues a focused recomputation including the historical bounding boxes that formed those clusters. The right‑side Feature Contribution Difference chart then lists original features sorted by an adjusted difference score. Large magnitude bars highlight variables most responsible for separation in score space; sign indicates directional contrast (e.g., higher noise in Cluster A vs. Cluster B). This view accelerates hypothesis formation about underlying physical or process differences.
Feature Contribution Difference Interpretation
| Scenario | Cluster Pair | Typical Interpretation |
|---|---|---|
| Lithography focus drift | “Cluster 1” (baseline) vs. “Cluster 2” (edge shift) | Large positive loadings on overlay / focus sensors indicate lens or stage miscalibration emerging. |
| CMP dishing excursion | Normal vs. Outlier cluster | Polishing pressure & slurry flow features dominate, suggesting pad condition or endpoint control drift. |
| Etch chamber mismatch | Tool A vs. Tool B clusters | Divergent RF power stability & pressure uniformity features highlight hardware imbalance. |
| Thermal drift in deposition | Stable vs. Drift cluster | Temperature loop variance & gas flow noise loadings spike, pointing to heater control or MFC degradation. |
Workflow Example
- Auto‑selected features produce initial PCA scatter.
- You notice a tail of points at high PC2.
- Brush that region → Create “Cluster 1”.
- Brush a dense central core → Create “Cluster 2”.
- Comparison panel shows strongest difference features: e.g., “STAGE_acceleration_noise” and “IMMERSION_fluid_temp”.
- Interpret: Elevated vibration + immersion temperature instability → possible cooling loop or mechanical damping issue.
- Download plot and export feature difference chart for an engineering review.
Best Practice Notes
- Prefer thematically coherent feature sets (e.g., only lithography alignment + stage condition metrics) for cleaner interpretability.
- Revisit clusters after any major feature list change because the PCA rotation will shift boundaries.
- Use multiple small boxes to approximate irregular shapes rather than one overly broad rectangle.
- Treat early clusters as exploratory “sketch layers,” refining them as emerging patterns stabilize.
FAQ
Do I need to rerun PCA after drawing clusters?
No. PCA scores stay fixed until you change the feature selection; clustering is a layer on top.
Why only PC1 vs. PC2?
They usually capture the dominant structure. Additional component views can be added later if separation is weak.
What if clusters overlap?
The most recently added bounding box takes precedence. Reorder by undoing and redrawing.
How is the difference score computed?
It is an adjusted contribution derived from feature loadings and score distributions that normalizes scale to highlight discriminative power.
Can I rename clusters?
No, cluster names are generated automatically (e.g., “Cluster 1”).
Are clusters shared with teammates?
Not by default; they are stored in your browser. Share exports for collaboration.
What do the σ (sigma) rings show?
Approximate radial standard deviation envelopes (1σ, 2σ, 3σ) in the PC1–PC2 plane—useful for spotting outliers.
My difference panel is empty—why?
Create at least one cluster to enable pairwise comparison. If only one cluster exists, it is compared against unassigned points.
After changing features my clusters look meaningless.
The PCA basis changed; recreate clusters for the new projection.
Is there a limit on number of boxes per cluster?
Practical limits are performance and clarity; many small overlapping boxes are harder to manage—periodically consolidate.