Feature Importance and Model Evaluation
Access Athinia Catalyst at catalyst.athinia.io.
The Feature Importance tool allows you to create, run, and evaluate machine learning models on your dataset to understand which variables have the most impact on your target variables. This powerful tool helps you identify critical factors affecting your manufacturing processes without requiring advanced data science expertise.
Getting Started
Creating a Model
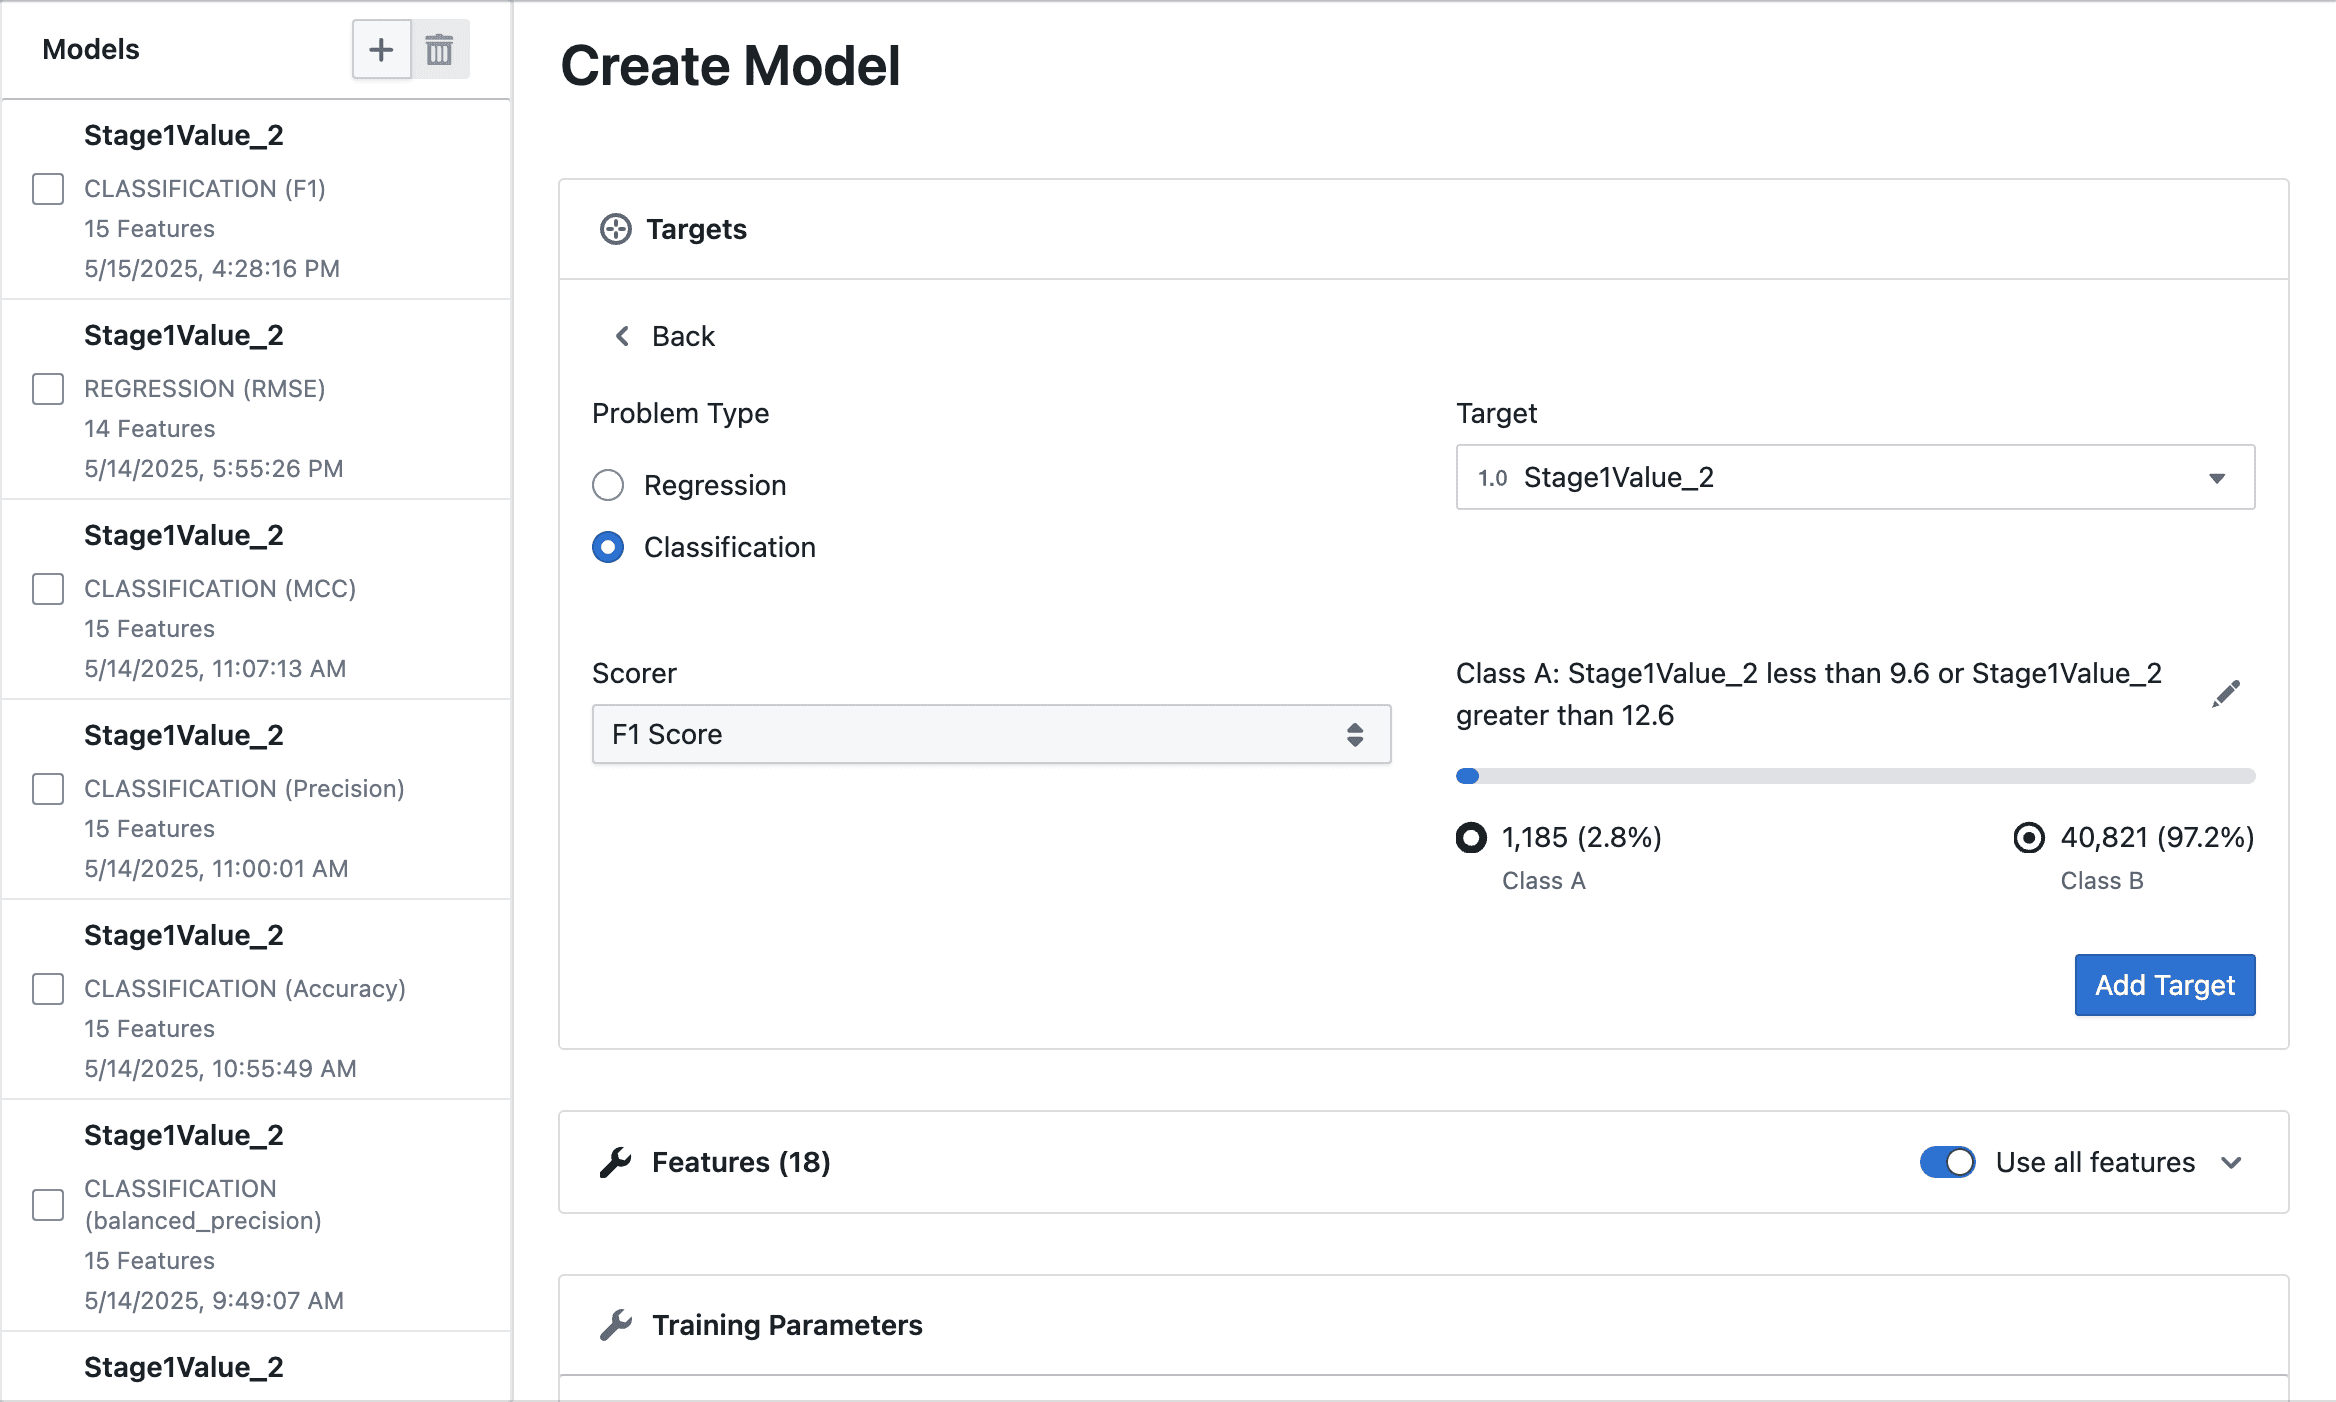
To create a new model, first navigate to the Feature Importance section in the application. In the Models panel, click the "Add Target" button. You will then be prompted to configure your model by selecting the appropriate settings for your analysis.
Problem Type
- Regression: For predicting continuous numeric values (e.g., thickness, yield, temperature)
- Classification: For predicting categories or classes (e.g., pass/fail, high/low)
Target Selection
To select your target variable, use the dropdown menu to choose the column you want to predict. For regression problems, only numerical columns are available as targets, while for classification, you can select from both numerical and categorical columns. Once you select a target, the system automatically removes it from the list of available features to prevent data leakage.
Scorer Selection
Select a metric to evaluate your model's performance. Follow this guide to learn more about choosing the right scorer.
-
Regression:
- MAE (Mean Absolute Error): Average absolute difference between predictions and actual values
- RMSE (Root Mean Squared Error): Square root of the average squared differences
- MedAE (Median Absolute Error): Median of absolute differences, robust to outliers
- R2 (R-squared): Proportion of variance explained by the model
-
Classification:
- F1 Score: Harmonic mean of precision and recall
- Precision: Ratio of true positives to all positive predictions
- Accuracy: Proportion of correct predictions (balanced)
- MCC (Matthews Correlation Coefficient): A balanced measure even with uneven classes
For classification problems, you can precisely define what constitutes "Class A" versus "Class B" using the built-in filter interface. This allows you to set conditions such as equals to, less than, or greater than, and to combine multiple conditions with AND/OR logic. As you define your classes, you can preview the distribution using an interactive progress bar and view the exact counts and percentages for each class. The system automatically assigns the smaller group as "Class A" to help balance the classes.
To choose which columns to include in your model, use the "Use all features" toggle to quickly select or deselect all columns at once. You can also click on individual features to add or remove them from your model as needed. The system automatically excludes your selected target column from the list of available features to prevent data leakage. Features are displayed in a grid format, with icons indicating their respective data types for easier identification.
Set the Training Time using the slider (1–120 minutes) to control how long the model trains—longer times enable more thorough model exploration, while shorter times yield quicker results for initial analysis. You can also enable Early Stopping to automatically end training when no further improvements are detected, which helps save computational resources and prevents overfitting on your data.
Creating Multiple Models
You can create multiple models with different targets, features, or settings to compare their performance. Each model appears as a card in the Models list and is identified by its target variable and type. This allows you to build and evaluate a combination of regression and classification models side by side.
Running Models
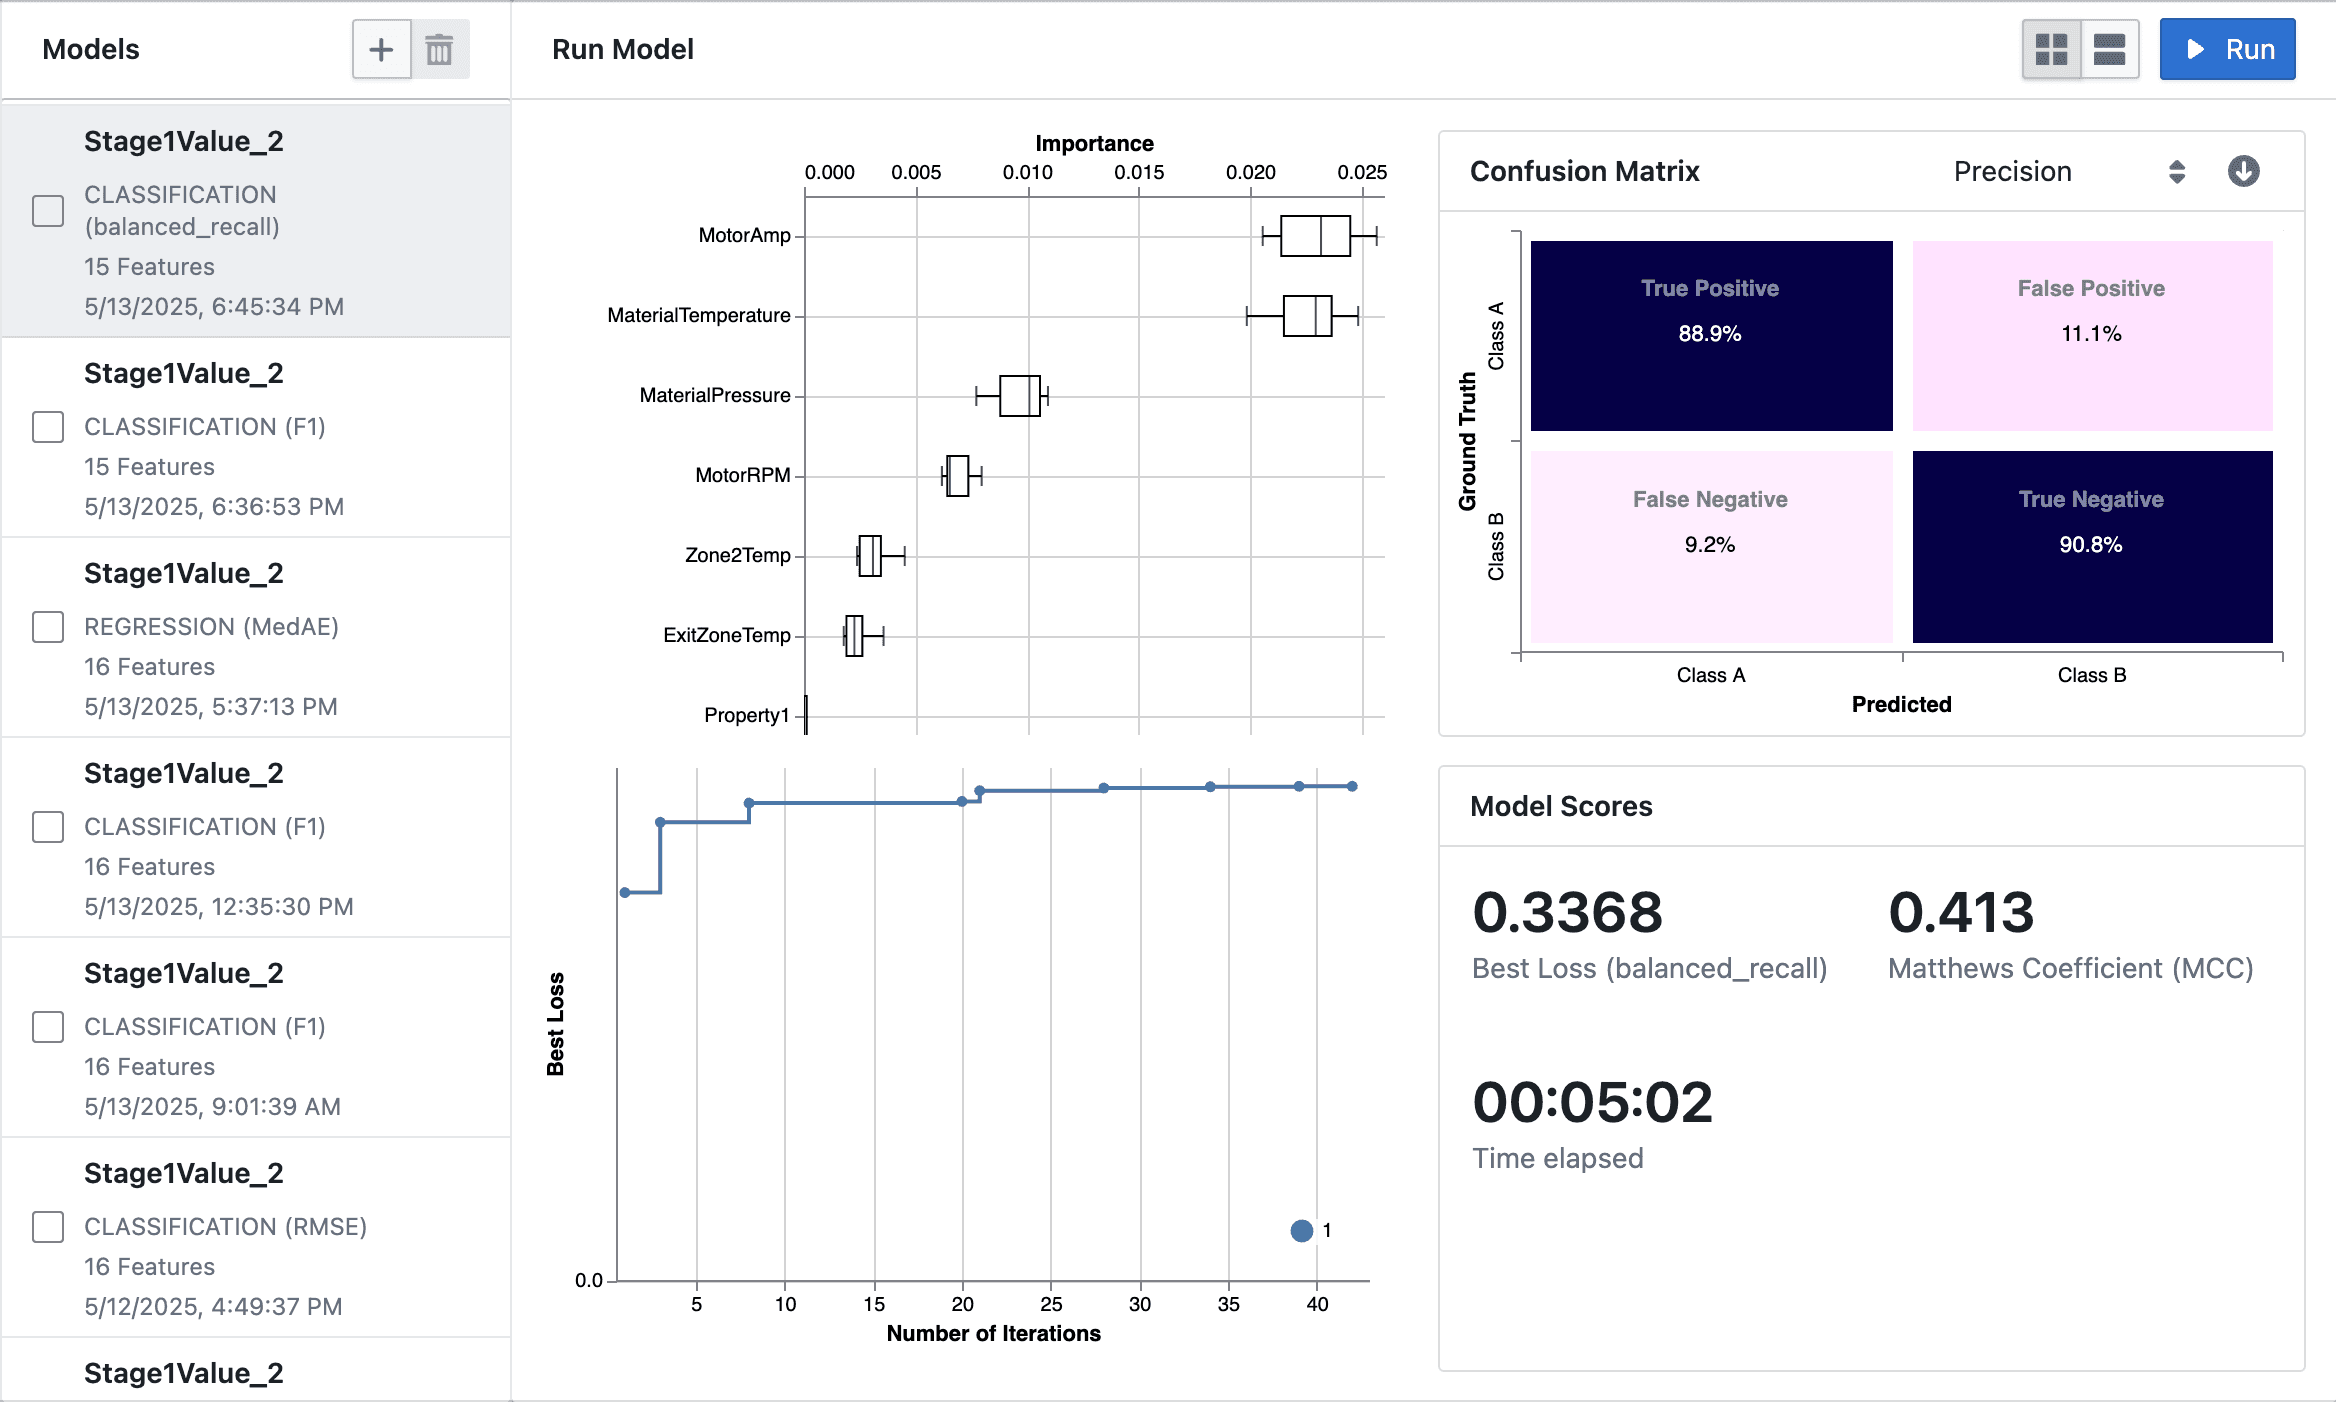
To run a model, first select it from the list and click the "Run" button to begin training. As the model trains, you can monitor its progress in real time, including the elapsed time (shown in hours:minutes:seconds), the best loss score as it improves, the number of training iterations completed, and additional metrics relevant to your model type, such as MCC or F1 score.
Analyzing Results
Layout Options
Toggle between grid view and row view using the layout buttons in the top right:
- Grid view: Shows all visualizations in a grid layout
- Row view: Displays visualizations in a sequential row format
Feature Importance
After training completes, the tool displays a box plot visualization that highlights which features have the greatest impact on your target variable. Features are ranked from most to least important, with those at the top exerting the strongest influence. Each box plot represents the distribution of importance scores for a feature across different training folds—longer boxes indicate greater variability in importance, while features with little or no impact appear at the bottom of the plot.
Classification Models
View a detailed confusion matrix showing:
- True Positives: Correctly predicted Class A samples
- True Negatives: Correctly predicted Class B samples
- False Positives: Class B samples incorrectly predicted as Class A
- False Negatives: Class A samples incorrectly predicted as Class B
Toggle between three different visualization modes:
- Absolute Count: Shows the raw number of samples in each category
- Precision: Displays the percentage of correct predictions for each predicted class
- Recall: Shows the percentage of each actual class that was correctly identified
The confusion matrix uses color intensity to highlight performance differences, with darker colors indicating higher values.
Regression Models
After training a regression model, you can examine a scatter plot that compares predicted values to actual values. Points that lie close to the diagonal line represent accurate predictions, while deviations from this line indicate areas where the model's predictions differ from the true values. This visualization helps you quickly identify regions where the model performs well and areas where it may need improvement.
Training Metrics
- Loss Plot: Shows how model performance improves over training iterations
- Model Popularity: Shows which algorithms performed best during training folds
- Best Score: Displays the best score achieved for your selected metric
- Additional Metrics: Shows secondary performance indicators like MCC
Managing Models
- Select Models: Check the boxes next to models to select multiple at once
- Delete Models: Use the trash icon to delete selected models
- Navigate Models: Click on any model card to view its details and results
- Compare Models: Select multiple models to compare their performance metrics
Best Practices
- Start with all features and identify which ones have the most impact
- Create multiple models with different configurations to compare performance
- Adjust training time based on your dataset size and complexity
- For classification problems, carefully define your classes using the binarizer tool
- Compare different scoring methods to get a complete picture of model performance
- For imbalanced datasets, prefer balanced metrics like MCC or balanced accuracy
- Use the confusion matrix visualization options (precision, recall, absolute count) to understand different aspects of model performance
- Review feature importances to identify which process variables most significantly impact your outcomes
By leveraging this tool, you can quickly identify which process parameters most significantly impact your manufacturing outcomes without needing to write code or have advanced statistical knowledge.
Frequently Asked Questions
Do I need to know machine learning to use this tool?
No. The tool is designed for manufacturing engineers and data analysts without machine learning expertise. All technical details are handled in the background.
How do I choose between Regression and Classification?
- Choose Regression when predicting a continuous numeric value (like thickness, temperature, etc.)
- Choose Classification when predicting categories or classes (like pass/fail, good/bad, etc.)
What's the difference between Class A and Class B in classification?
Class A and Class B are the two categories your model will learn to distinguish. You define these classes using the binarizer tool, which allows you to set conditions (like "temperature > 50°C"). The system shows you the distribution of your data between these classes. Class A is the minority class, or positive class, while Class B is the majority class, or negative class.
Can I create models for multiple target variables?
Yes, you can create separate models for different target variables and compare their results. This helps you understand relationships between different process outcomes.
What happens if my dataset is imbalanced?
For classification problems, highly imbalanced datasets (where one class is much more common than the other) may benefit from using balanced metrics like MCC. The binarizer tool shows you the class distribution to help you make informed decisions.
How many features should I include in my model?
You can include as many or as few features as you want. A common approach is to start with all available features and then use the feature importance results to identify which ones matter most.
What is Early Stopping?
Early Stopping is a feature that automatically ends training when the model stops improving. This saves computational resources and helps prevent overfitting (when a model performs well on training data but poorly on new data).
How do I interpret the Feature Importance plot?
The Feature Importance plot ranks features from most to least important. Features at the top have the strongest influence on your target variable. Box plots show the distribution of importance across training iterations, with wider boxes indicating more variability.
What's the difference between the various scorers?
Please take a look at the Choosing the Right Scorer page for a detailed explanation of each scorer and when to use them.
What if my model doesn't perform well?
If your model doesn't perform well, you can try:
- Including different features
- Increasing training time
- Adjusting class definitions for classification problems
- Trying a different scorer that might better align with your objectives
How does the system handle missing values?
The system automatically handles missing values using industry-standard imputation techniques, so you don't need to worry about data preparation.
Can I export or share the results?
Yes, you can export visualizations by clicking the download button in the corner of each chart. This makes it easy to share insights with colleagues or include in reports.
Does my data leave my workspace?
No, all processing happens within your secure workspace. Your data never leaves your environment during model training or analysis.
Can I use the trained model to make predictions on new data?
Currently, the tool is focused on feature importance analysis rather than deploying predictive models. Contact your administrator if you need deployment capabilities.