Filtering
The Data Filtering component allows you to refine your dataset by creating precise filter conditions. This powerful tool helps you focus on specific subsets of your data by including or excluding rows based on column values, making your analysis more targeted and efficient.
The filter component can be accessed via the "Filter" button in the toolbar next to the study name.
Key Features
Filter Logic Options
The component supports two primary filtering approaches:
- Keep rows that match your conditions
- Drop rows that match your conditions
Condition Logic
For each filter group, you can specify whether rows should match:
- All conditions (AND logic)
- Any condition (OR logic)
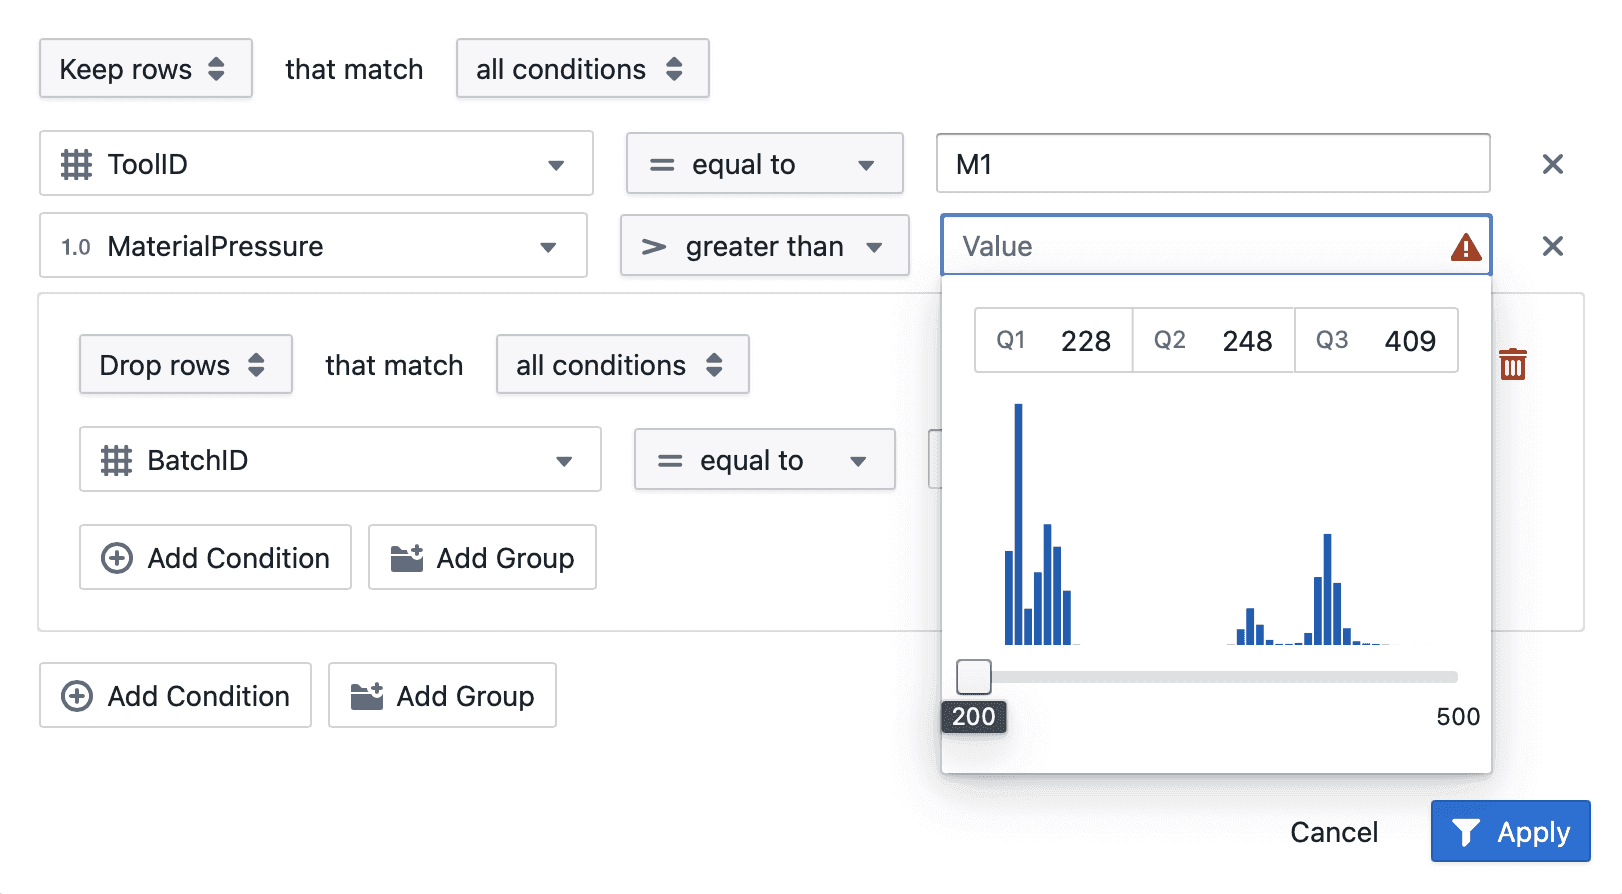
Visual Data Distribution
When setting numeric filters, the component provides a histogram visualization showing the distribution of values in your dataset, including:
- Quartile markers (Q1, Q2, Q3)
- A slider to visually select value ranges
- Exact numeric inputs for precise filtering
For categorical columns, a searchable dropdown or checklist allows you to select specific values easily. The values are sorted by frequency, making it easier to find the most common entries.
Using the Filter Component
Creating Basic Filters
- Click on the filter button or area to open the filter popover
- Select whether you want to Keep rows or Drop rows that match your conditions
- Choose a column to filter on from the dropdown menu
- Select a comparison operator (equal to, greater than, less than, etc.)
- Enter or select the value(s) to filter by
- Click Apply to activate the filter
Advanced Filtering Techniques
Creating Multiple Conditions
- Click the Add Condition button to add another condition within the same group
- Set up the new condition with column, operator, and value
- Conditions within the same group are combined according to the selected logic (all/any)
Working with Filter Groups
- Click the Add Group button to create a new group of conditions
- Each group can have its own logic (all/any)
- Groups themselves are combined with the top-level logic
Nested Filtering
You can create sophisticated filters by nesting groups:
- Create a primary filter group
- Add conditions to the group
- Add a nested group using the Add Group button
- Set different logic for the nested group
Visual Selection for Numeric Values
For numeric columns, the filter provides additional visual tools:
- A histogram shows the distribution of values in your dataset
- Key statistics (Q1, Q2, Q3) are displayed for reference
- Use the slider to quickly select a range of values
- Enter precise numbers in the input fields for exact filtering
Saved Filters
You can save a filter and reuse it later in the same study.
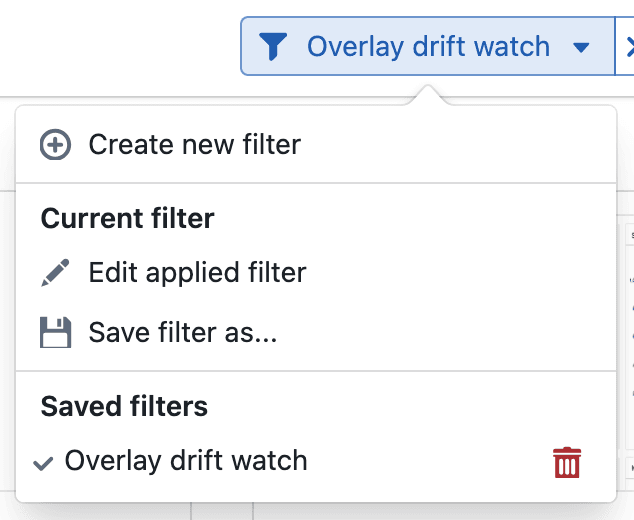
Saving a Filter
- Apply a filter to the study
- Open the filter menu
- Select Save filter as...
- Enter a filter name
- Save it for reuse
Reusing or Removing a Saved Filter
- Open the filter menu to apply a saved filter
- Reopen the current filter to edit its conditions
- Delete a saved filter from the saved filter list
- Use the clear action in the toolbar to remove the active filter
Removing Filters
- Click the X button next to a condition to remove it
- Click the trash icon to remove an entire group of conditions
- Click Cancel to discard all changes to the filter
Tips for Effective Filtering
-
Start Broad, Then Refine: Begin with simple filters and add complexity as needed.
-
Use the Histogram: For numeric data, the histogram visualization helps identify meaningful thresholds for filtering.
-
Combine Filter Types: Use both "Keep rows" and "Drop rows" in different groups to achieve complex filtering logic.
-
Check Your Results: After applying filters, review your dataset to ensure the filter is behaving as expected.
-
Use Negation Carefully: Sometimes it's more intuitive to use "Keep rows" with a positive condition than "Drop rows" with a negative condition.
The Filter component is designed to provide both simplicity for basic filtering needs and power for complex data selection scenarios, helping you focus on exactly the data points relevant to your analysis.
Frequently Asked Questions
How do "all conditions" and "any condition" differ?
"All conditions" requires every condition in the group to be true (AND logic) for a row to match. "Any condition" requires just one condition to be true (OR logic) for a match.
Can I filter on multiple columns at once?
Yes! You can add multiple conditions that reference different columns within the same group or across different groups.
How do nested filter groups work?
Nested groups allow you to create complex logical expressions. The inner group is evaluated first as a single condition within the outer group. This enables you to create filters like "(A AND B) OR (C AND D)".
What do the Q1, Q2, and Q3 values represent?
These are quartile values from your data distribution. Q1 (25th percentile) means 25% of values fall below this point. Q2 (50th percentile) is the median. Q3 (75th percentile) means 75% of values fall below this point.
Can I filter on dates and times?
Yes, date and time columns have specialized operators and input formats designed for temporal data filtering.
Why am I seeing a warning icon in my filter?
A warning icon appears when your filter condition might have issues, such as an invalid value format or a condition that would exclude all data.
Can I create a filter to find null or missing values?
Yes, most columns support special operators like "is null" or "is not null" to specifically filter for missing data.
How do I filter categorical data with many values?
For categorical columns, the filter includes a searchable dropdown or checklist that lets you select values easily.
What happens if my filter matches no data?
If your filter conditions don't match any rows, you'll typically see an empty dataset or a notification indicating no matching data was found.